

Question: can anyone help me with these? Scatterplot of SALARY vs STUDENTS 120000 100000 80000 SALARY 60000 40000 20000 2000 8000 10000 4000 6000 STUDENTS C1
can anyone help me with these? 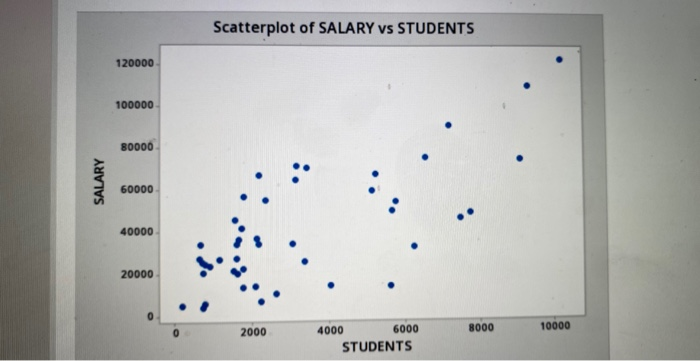
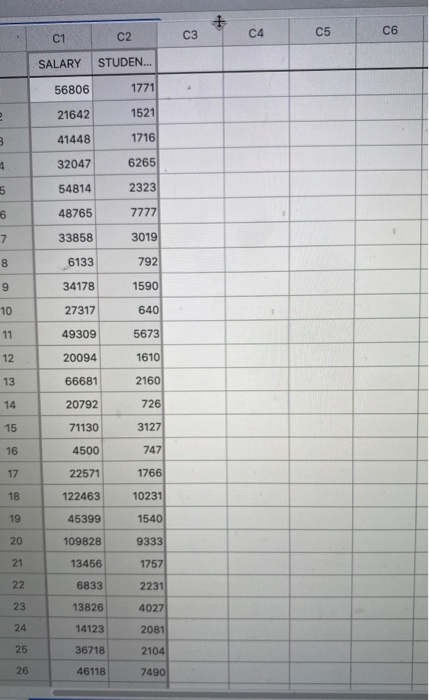
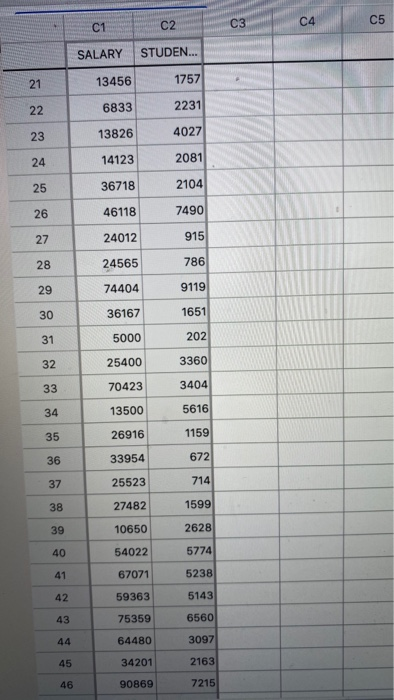
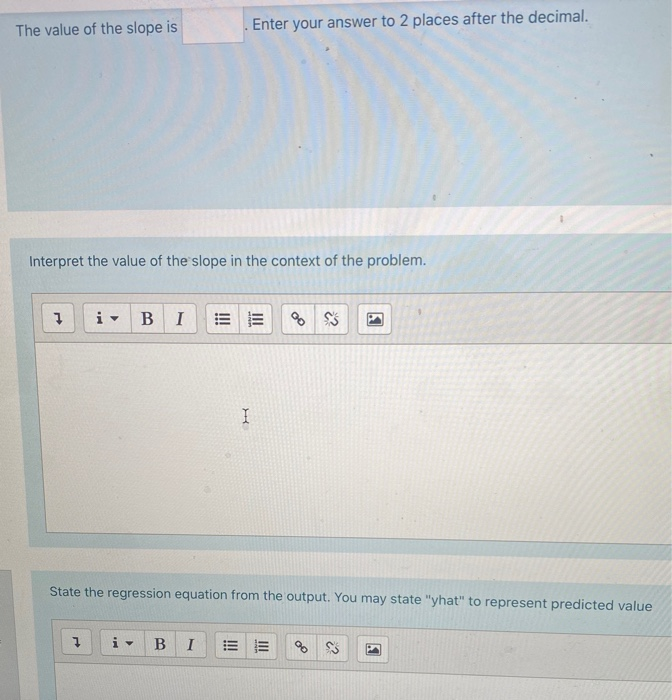
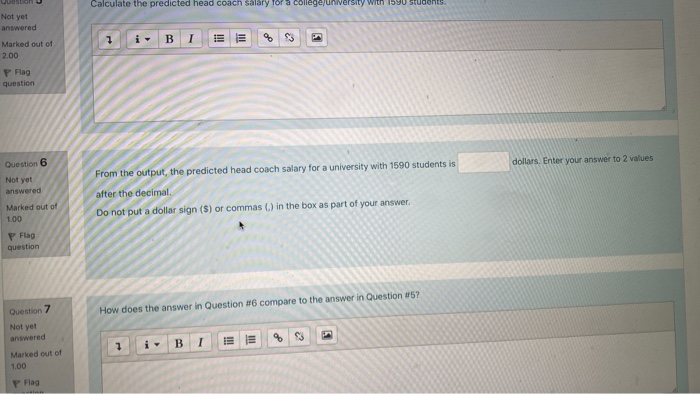
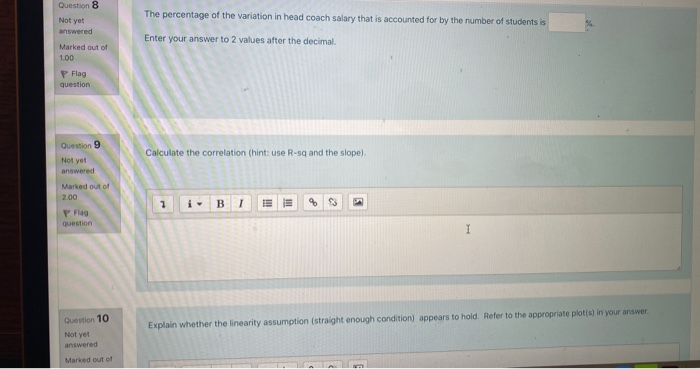
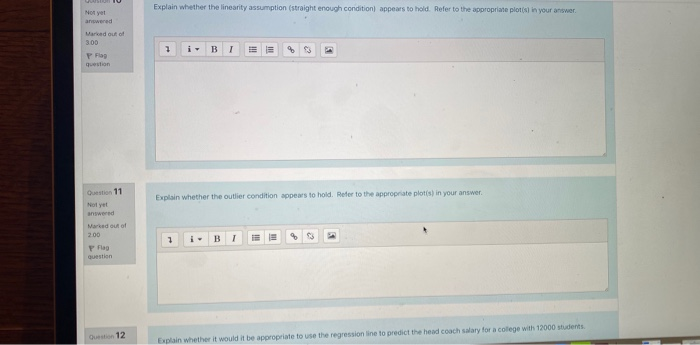
Scatterplot of SALARY vs STUDENTS 120000 100000 80000 SALARY 60000 40000 20000 2000 8000 10000 4000 6000 STUDENTS C1 C2 C3 C4 C5 C6 SALARY STUDEN... 56806 1771 2 21642 1521 3 41448 1716 4 32047 6265 5 54814 2323 6 48765 7777 7 33858 3019 8 6133 792 9 34178 1590 10 27317 640 11 49309 5673 12 20094 1610 13 66681 2160 14 20792 726 15 71130 3127 16 4500 747 17 22571 1766 18 122463 10231 19 45399 1540 20 109828 9333 21 13456 1757 22 6833 2231 23 13826 4027 24 14123 2081 25 36718 2104 26 46118 7490 C1 C2 C3 C4 C5 SALARY STUDEN... 21 13456 1757 22 6833 2231 23 13826 4027 24 14123 2081 25 36718 2104 26 46118 7490 27 24012 915 28 24565 786 29 74404 9119 30 36167 1651 31 5000 202 32 25400 3360 33 70423 3404 34 13500 5616 35 26916 1159 36 33954 672 37 25523 714 38 27482 1599 39 10650 2628 40 54022 5774 41 67071 5238 42 59363 5143 43 75359 6560 44 64480 3097 45 34201 2163 46 90869 7215 The value of the slope is Enter your answer to 2 places after the decimal. Interpret the value of the slope in the context of the problem. 1 7 iii III de c? I State the regression equation from the output. You may state "yhat" to represent predicted value 1 B 1 15 E Calculate the predicted head coach salary for a college/university with 1590 students Not yet answered 1 B I Marked out of 2.00 P Flag question dollars. Enter your answer to 2 values Question 6 Not yet answered From the output, the predicted head coach salary for a university with 1590 students is after the decimal. Do not put a dollar sign ($) or commas () in the box as part of your answer. Marked out of 1.00 P Flag question How does the answer in Question #6 compare to the answer in Question #5? Question 7 Not yet answered Marked out of 1.00 3 1 B 1 P Flag Question 8 The percentage of the variation in head coach salary that is accounted for by the number of students is Not yet answered Enter your answer to 2 values after the decimal. Marked out of 1.00 P Flag question Question 9 Not yet answered Calculate the correlation (hint: use R-sq and the slope) Marked out of 2.00 i B 1 $3 P Flag question Question 10 Explain whether the linearity assumption (straight enough condition) appears to hold. Refer to the appropriate plot(s) in your answer Not yet answered Marked out of Explain whether the linearity assumption (straight enough condition appears to hold Refer to the appropriate plots in your answer Not yet arwered Maried out of 3.00 7 B 1 9 P Flag question Question 11 Not yet wered Explain whether the outlier condition appears to hold. Refer to the appropriate plot(s) in your answer. Marked out of 2.00 2 P Flag Question 12 Explain whether it would it be appropriate to use the regression line to predict the head coach salary for a college with 12000 students Step by Step Solution
There are 3 Steps involved in it
1 Expert Approved Answer
Step: 1 Unlock

Question Has Been Solved by an Expert!
Get step-by-step solutions from verified subject matter experts
Step: 2 Unlock
Step: 3 Unlock