

Question: Can anyone help on Section E Section E The following are to be completed in the Profit Volume Forecast Worksheet In this sheet we want
Can anyone help on Section E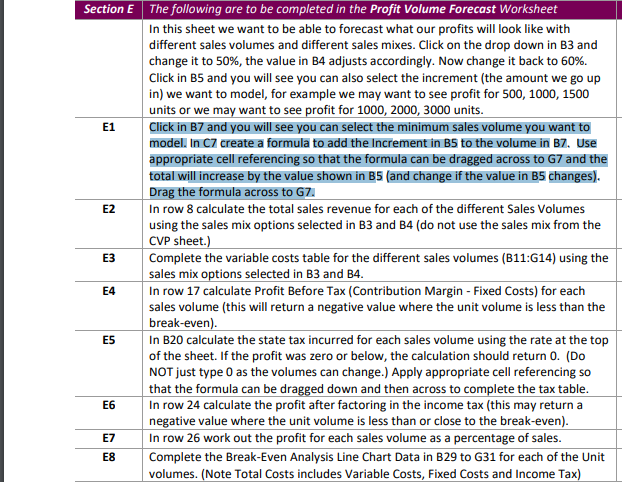
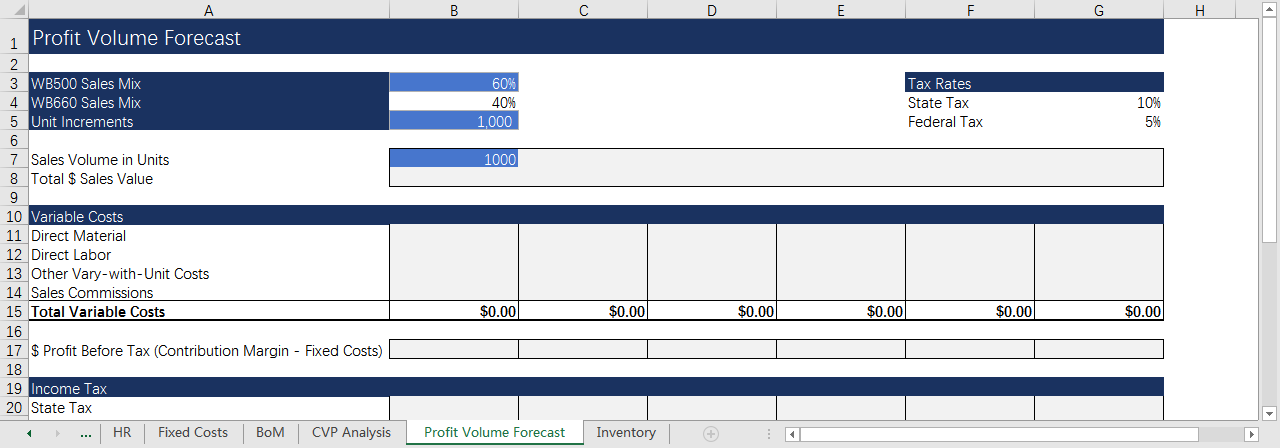
Section E The following are to be completed in the Profit Volume Forecast Worksheet In this sheet we want to be able to forecast what our profits will look like with different sales volumes and different sales mixes. Click on the drop down in B3 and change it to 50%, the value in B4 adjusts accordingly. Now change it back to 60%. Click in B5 and you will see you can also select the increment (the amount we go up in) we want to model, for example we may want to see profit for 500, 1000, 1500 units or we may want to see profit for 1000, 2000, 3000 units. E1 Click in B7 and you will see you can select the minimum sales volume you want to model. In 7 create a formula to add the Increment in B5 to the volume in B7. Use appropriate cell referencing so that the formula can be dragged across to G7 and the total will increase by the value shown in B5 (and change if the value in B5 changes). Drag the formula across to G7 E2 In row 8 calculate the total sales revenue for each of the different Sales Volumes using the sales mix options selected in B3 and B4 (do not use the sales mix from the CVP sheet.) E3 Complete the variable costs table for the different sales volumes (B11:614) using the sales mix options selected in B3 and 34. E4 In row 17 calculate Profit Before Tax (Contribution Margin - Fixed Costs) for each sales volume (this will return a negative value where the unit volume is less than the break-even). In B20 calculate the state tax incurred for each sales volume using the rate at the top of the sheet. If the profit was zero or below, the calculation should return O. (Do NOT just type 0 as the volumes can change.) Apply appropriate cell referencing so that the formula can be dragged down and then across to complete the tax table. In row 24 calculate the profit after factoring in the income tax (this may return a negative value where the unit volume is less than or close to the break-even). E7 In row 26 work out the profit for each sales volume as a percentage of sales. Complete the Break-Even Analysis Line Chart Data in B29 to G31 for each of the Unit volumes. (Note Total Costs includes Variable Costs, Fixed Costs and Income Tax) E5 E6 E8 B D G 1 Profit Volume Forecast 60% 40% 1,000 Tax Rates State Tax Federal Tax 10% 5% 1000 3 WB500 Sales Mix 4 WB660 Sales Mix 5 Unit Increments 6 7 Sales Volume in Units 8 Total $ Sales Value 9 10 Variable Costs 11 Direct Material 12 Direct Labor 13 Other Vary-with-Unit Costs 14 Sales Commissions 15 Total Variable Costs 16 17 $ Profit Before Tax (Contribution Margin - Fixed Costs) 18 19 Income Tax 20 State Tax HR Fixed Costs BoM CVP Analysis $0.00 $0.00 $0.00 $0.00 $0.00 $0.00 Profit Volume Forecast Inventory Section E The following are to be completed in the Profit Volume Forecast Worksheet In this sheet we want to be able to forecast what our profits will look like with different sales volumes and different sales mixes. Click on the drop down in B3 and change it to 50%, the value in B4 adjusts accordingly. Now change it back to 60%. Click in B5 and you will see you can also select the increment (the amount we go up in) we want to model, for example we may want to see profit for 500, 1000, 1500 units or we may want to see profit for 1000, 2000, 3000 units. E1 Click in B7 and you will see you can select the minimum sales volume you want to model. In 7 create a formula to add the Increment in B5 to the volume in B7. Use appropriate cell referencing so that the formula can be dragged across to G7 and the total will increase by the value shown in B5 (and change if the value in B5 changes). Drag the formula across to G7 E2 In row 8 calculate the total sales revenue for each of the different Sales Volumes using the sales mix options selected in B3 and B4 (do not use the sales mix from the CVP sheet.) E3 Complete the variable costs table for the different sales volumes (B11:614) using the sales mix options selected in B3 and 34. E4 In row 17 calculate Profit Before Tax (Contribution Margin - Fixed Costs) for each sales volume (this will return a negative value where the unit volume is less than the break-even). In B20 calculate the state tax incurred for each sales volume using the rate at the top of the sheet. If the profit was zero or below, the calculation should return O. (Do NOT just type 0 as the volumes can change.) Apply appropriate cell referencing so that the formula can be dragged down and then across to complete the tax table. In row 24 calculate the profit after factoring in the income tax (this may return a negative value where the unit volume is less than or close to the break-even). E7 In row 26 work out the profit for each sales volume as a percentage of sales. Complete the Break-Even Analysis Line Chart Data in B29 to G31 for each of the Unit volumes. (Note Total Costs includes Variable Costs, Fixed Costs and Income Tax) E5 E6 E8 B D G 1 Profit Volume Forecast 60% 40% 1,000 Tax Rates State Tax Federal Tax 10% 5% 1000 3 WB500 Sales Mix 4 WB660 Sales Mix 5 Unit Increments 6 7 Sales Volume in Units 8 Total $ Sales Value 9 10 Variable Costs 11 Direct Material 12 Direct Labor 13 Other Vary-with-Unit Costs 14 Sales Commissions 15 Total Variable Costs 16 17 $ Profit Before Tax (Contribution Margin - Fixed Costs) 18 19 Income Tax 20 State Tax HR Fixed Costs BoM CVP Analysis $0.00 $0.00 $0.00 $0.00 $0.00 $0.00 Profit Volume Forecast Inventory
Step by Step Solution
There are 3 Steps involved in it

Get step-by-step solutions from verified subject matter experts