Question: Can anyone help to answer the following two question? Go to Correlation worksheet Q1-Discuss what happens when the following correlations are used in cell E5:

Can anyone help to answer the following two question?

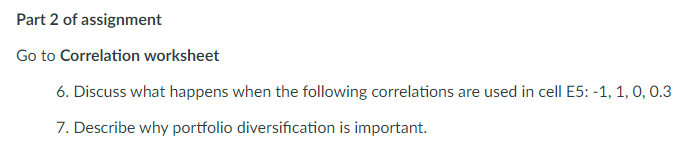
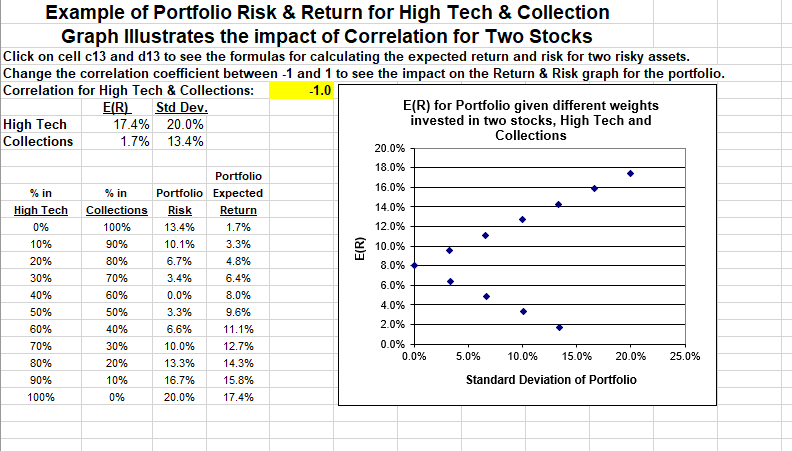
Go toCorrelation worksheet

Q1-Discuss what happens when the following correlations are used in cell E5: -1, 1, 0, 0.3

Q2-Describe why portfolio diversification is important.

Can anyone help to answer the following twoCan anyone help to answer the following twoCan anyone help to answer the following two
Part 2 of assignment Go to Correlation worksheet 6. Discuss what happens when the following correlations are used in cell E5: -1, 1, 0, 0.3 7. Describe why portfolio diversification is important.Example of Portfolio Risk & Return for High Tech & Collection Graph Illustrates the impact of Correlation for Two Stocks Click on cell c13 and d13 to see the formulas for calculating the expected return and risk for two risky assets. Change the correlation coefficient between -1 and 1 to see the impact on the Return & Risk graph for the portfolio. Correlation for High Tech & Collections: -1.0 E(R) Std Dev. E(R) for Portfolio given different weights High Tech 17.4% 20.0% invested in two stocks, High Tech and Collections 1.7% 13.4% Collections 20.0% 18.0% Portfolio % in % in Portfolio Expected 16.0% High Tech Collections Risk Return 14.0% 0% 100% 13.4% 1.7% 12.0% 10% 90% 10.1% 3.3% E(R) 10.0% 20% 80% 6.7% 4.8% 8.0% 30% 70% 3.4% 6.4% 6.0% 40% 60% 0.0% 8.0% 4.0% 50% 50% 3.3% 9.6% 60% 40% 6.6% 11.1% 2.0% 70% 30% 10.0% 12.7% 0.0% 0.0% 5.0% 10.0% 15.0% 20.0% 25.0% 80% 20% 13.3% 14.3% 90% 10% 16.7% 15.8% Standard Deviation of Portfolio 100% 0% 20.0% 17.4%Estimated Rate of Return on Investments State of Prob. High U.S. Market 2-Stocks Economy of State T-Bills Tech Coll. Rubber Portfolio HT&Coll Recession 0. 1 8.0% -22.0% 28.0% 10.0% -13.0% Below Average 0.2 8.0% -2.0% 14.7% -10.0% 1.0% Average 0.4 8.0% 20.0% 0.0% 7.0% 15.0% Above Average 0.2 8.0% 35.0% -10.0% 45.0% 29.0% Boom 0.1 8.0% 50.0% -20.0% 30.0% 43.0% E(R) 8.0% 1.7% 13.8% 15.0% Standard Deviation 0.0% 13.4% 18.8% 15.3%

Step by Step Solution

There are 3 Steps involved in it

1 Expert Approved Answer
Step: 1 Unlock blur-text-image
Question Has Been Solved by an Expert!

Get step-by-step solutions from verified subject matter experts

Step: 2 Unlock
Step: 3 Unlock

Students Have Also Explored These Related Finance Questions!