Question: Can anyone please help with these. not sure what test to use so included them all Question 1. (15 marks] Do doctors discriminate against overweight

Can anyone please help with these. not sure what test to use so included them all Can anyone please help with these. not sure what
Can anyone please help with these. not sure what
Question 1. (15 marks] Do doctors discriminate against overweight patients ? This question uses data from an experiment by Hebl & Xul. The research examined physicians treatment of obesity in their patients more systematically by extending past research to look at physicians' behavioral intentions as well as their expressed attitudes toward male and female patients who are of average weight or overweight. A total of 71 primary care physicians affiliated with one of three major hospitals in the Texas Medical Center of Houston participated in the study. These physicians were sent a packet containing a medical chart similar to the one they view upon seeing a patient. This chart portrayed a patient who was displaying symptoms of a migraine headache but was other- wise healthy. Two variables (the gender and the weight of the patient) were manipulated across six different versions of the medical charts. The weight of the patient, described in terms of Body Mass Index (BMI), was average (BMI = 23) or overweight (BMI = 30). Physicians were randomly assigned to receive one of the six charts, were asked to look over the chart carefully, and then complete two medical forms. The first form asked physicians which of 42 tests that they would recommend giving to the patient. The second form asked physicians to indicate how much time they believed they would spend with the patient, and to describe the reactions that they would have toward this patient. For this question, only the question on how much time the physicians believed they would spend with the patient will be analysed. These data are included in the file & patientsize.omv. (a) [2 marks] Produce a graph to investigate the relationship between weight group and estimated time spent and comment on it. (b) [6 marks] Carry out an appropriate hypothesis test to investigate this relationship. Make sure to report the hypotheses tested, test statistic, null distribution, p-value and conclusion in plain language. (c) [3 marks) Produce a 95% confidence interval for the difference in estimated time between the two groups. Give the confidence interval in a sentence. Does this confidence interval support your decision in part (b)? (d) (4 marks] State and check whether the assumptions of this test have been met. 60 40 time 20 average overweight weight Independent Samples T-Test Statistic df P time Student'st 2.86 69.0 0.006 Normality Test (Shapiro-Wik) w P time 0.949 0.006 Note. A low p-value sugests a violation of the assumption of normally Homogeneity of Variances Test F df 012 GOMA 1 0.849 Not A low p-value suggests a violation of the assumption of equal variances Focu Question 1. (15 marks] Do doctors discriminate against overweight patients ? This question uses data from an experiment by Hebl & Xul. The research examined physicians treatment of obesity in their patients more systematically by extending past research to look at physicians' behavioral intentions as well as their expressed attitudes toward male and female patients who are of average weight or overweight. A total of 71 primary care physicians affiliated with one of three major hospitals in the Texas Medical Center of Houston participated in the study. These physicians were sent a packet containing a medical chart similar to the one they view upon seeing a patient. This chart portrayed a patient who was displaying symptoms of a migraine headache but was other- wise healthy. Two variables (the gender and the weight of the patient) were manipulated across six different versions of the medical charts. The weight of the patient, described in terms of Body Mass Index (BMI), was average (BMI = 23) or overweight (BMI = 30). Physicians were randomly assigned to receive one of the six charts, were asked to look over the chart carefully, and then complete two medical forms. The first form asked physicians which of 42 tests that they would recommend giving to the patient. The second form asked physicians to indicate how much time they believed they would spend with the patient, and to describe the reactions that they would have toward this patient. For this question, only the question on how much time the physicians believed they would spend with the patient will be analysed. These data are included in the file & patientsize.omv. (a) [2 marks] Produce a graph to investigate the relationship between weight group and estimated time spent and comment on it. (b) [6 marks] Carry out an appropriate hypothesis test to investigate this relationship. Make sure to report the hypotheses tested, test statistic, null distribution, p-value and conclusion in plain language. (c) [3 marks) Produce a 95% confidence interval for the difference in estimated time between the two groups. Give the confidence interval in a sentence. Does this confidence interval support your decision in part (b)? (d) (4 marks] State and check whether the assumptions of this test have been met. 60 40 time 20 average overweight weight Independent Samples T-Test Statistic df P time Student'st 2.86 69.0 0.006 Normality Test (Shapiro-Wik) w P time 0.949 0.006 Note. A low p-value sugests a violation of the assumption of normally Homogeneity of Variances Test F df 012 GOMA 1 0.849 Not A low p-value suggests a violation of the assumption of equal variances Focu

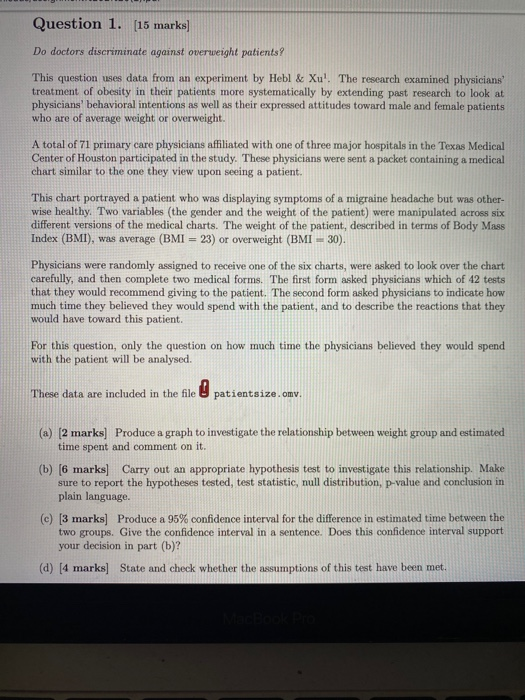
Step by Step Solution

There are 3 Steps involved in it

1 Expert Approved Answer
Step: 1 Unlock blur-text-image
Question Has Been Solved by an Expert!

Get step-by-step solutions from verified subject matter experts

Step: 2 Unlock
Step: 3 Unlock

Students Have Also Explored These Related General Management Questions!