

Question: Can do it by hand and send a pic pls Table 3-3 Quantity Quantity Price per Demanded Supplied Bushel (bushels) (bushels) $2 40,000 36,000 4,000
Can do it by hand and send a pic pls
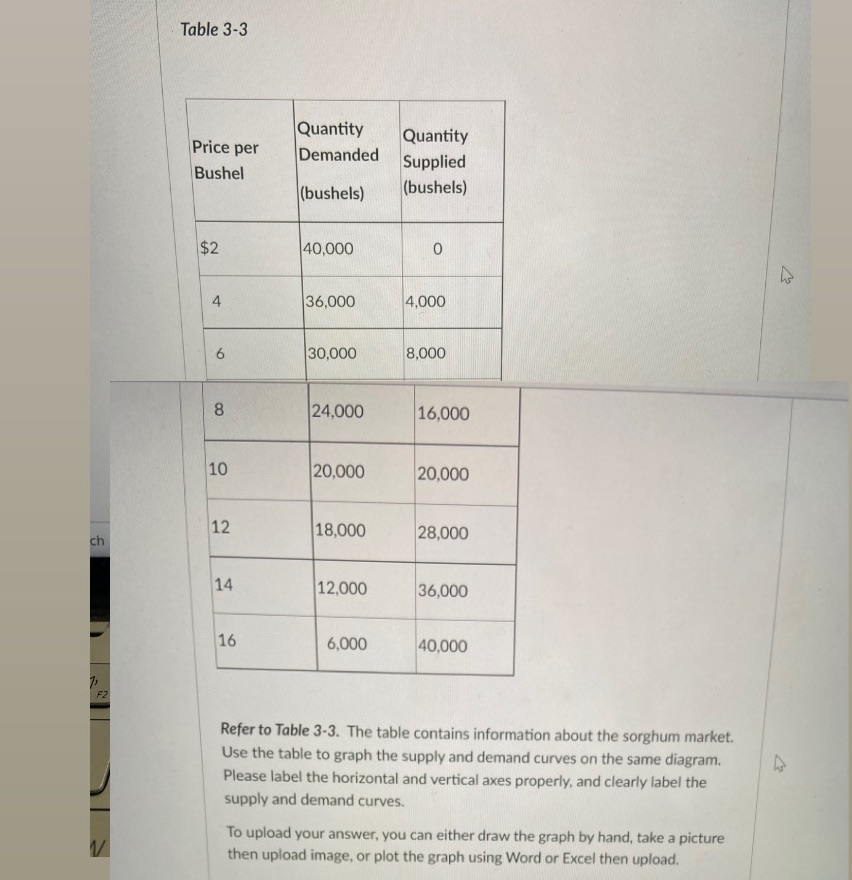
Table 3-3 Quantity Quantity Price per Demanded Supplied Bushel (bushels) (bushels) $2 40,000 36,000 4,000 30,000 8,000 24,000 16,000 10 20,000 20,000 12 18,000 28,000 Ch 14 12,000 36,000 16 6,000 40,000 Refer to Table 3-3. The table contains information about the sorghum market. Use the table to graph the supply and demand curves on the same diagram. Please label the horizontal and vertical axes properly, and clearly label the supply and demand curves. To upload your answer, you can either draw the graph by hand, take a picture then upload image, or plot the graph using Word or Excel then upload
Step by Step Solution
There are 3 Steps involved in it
1 Expert Approved Answer
Step: 1 Unlock

Question Has Been Solved by an Expert!
Get step-by-step solutions from verified subject matter experts
Step: 2 Unlock
Step: 3 Unlock