

Question: Can I ask how to calculate t score given sample size, mean, standard deviation and one sided p-value? 16:22 SMU Classification: Confidential .all 4G Done
Can I ask how to calculate t score given sample size, mean, standard deviation and one sided p-value?
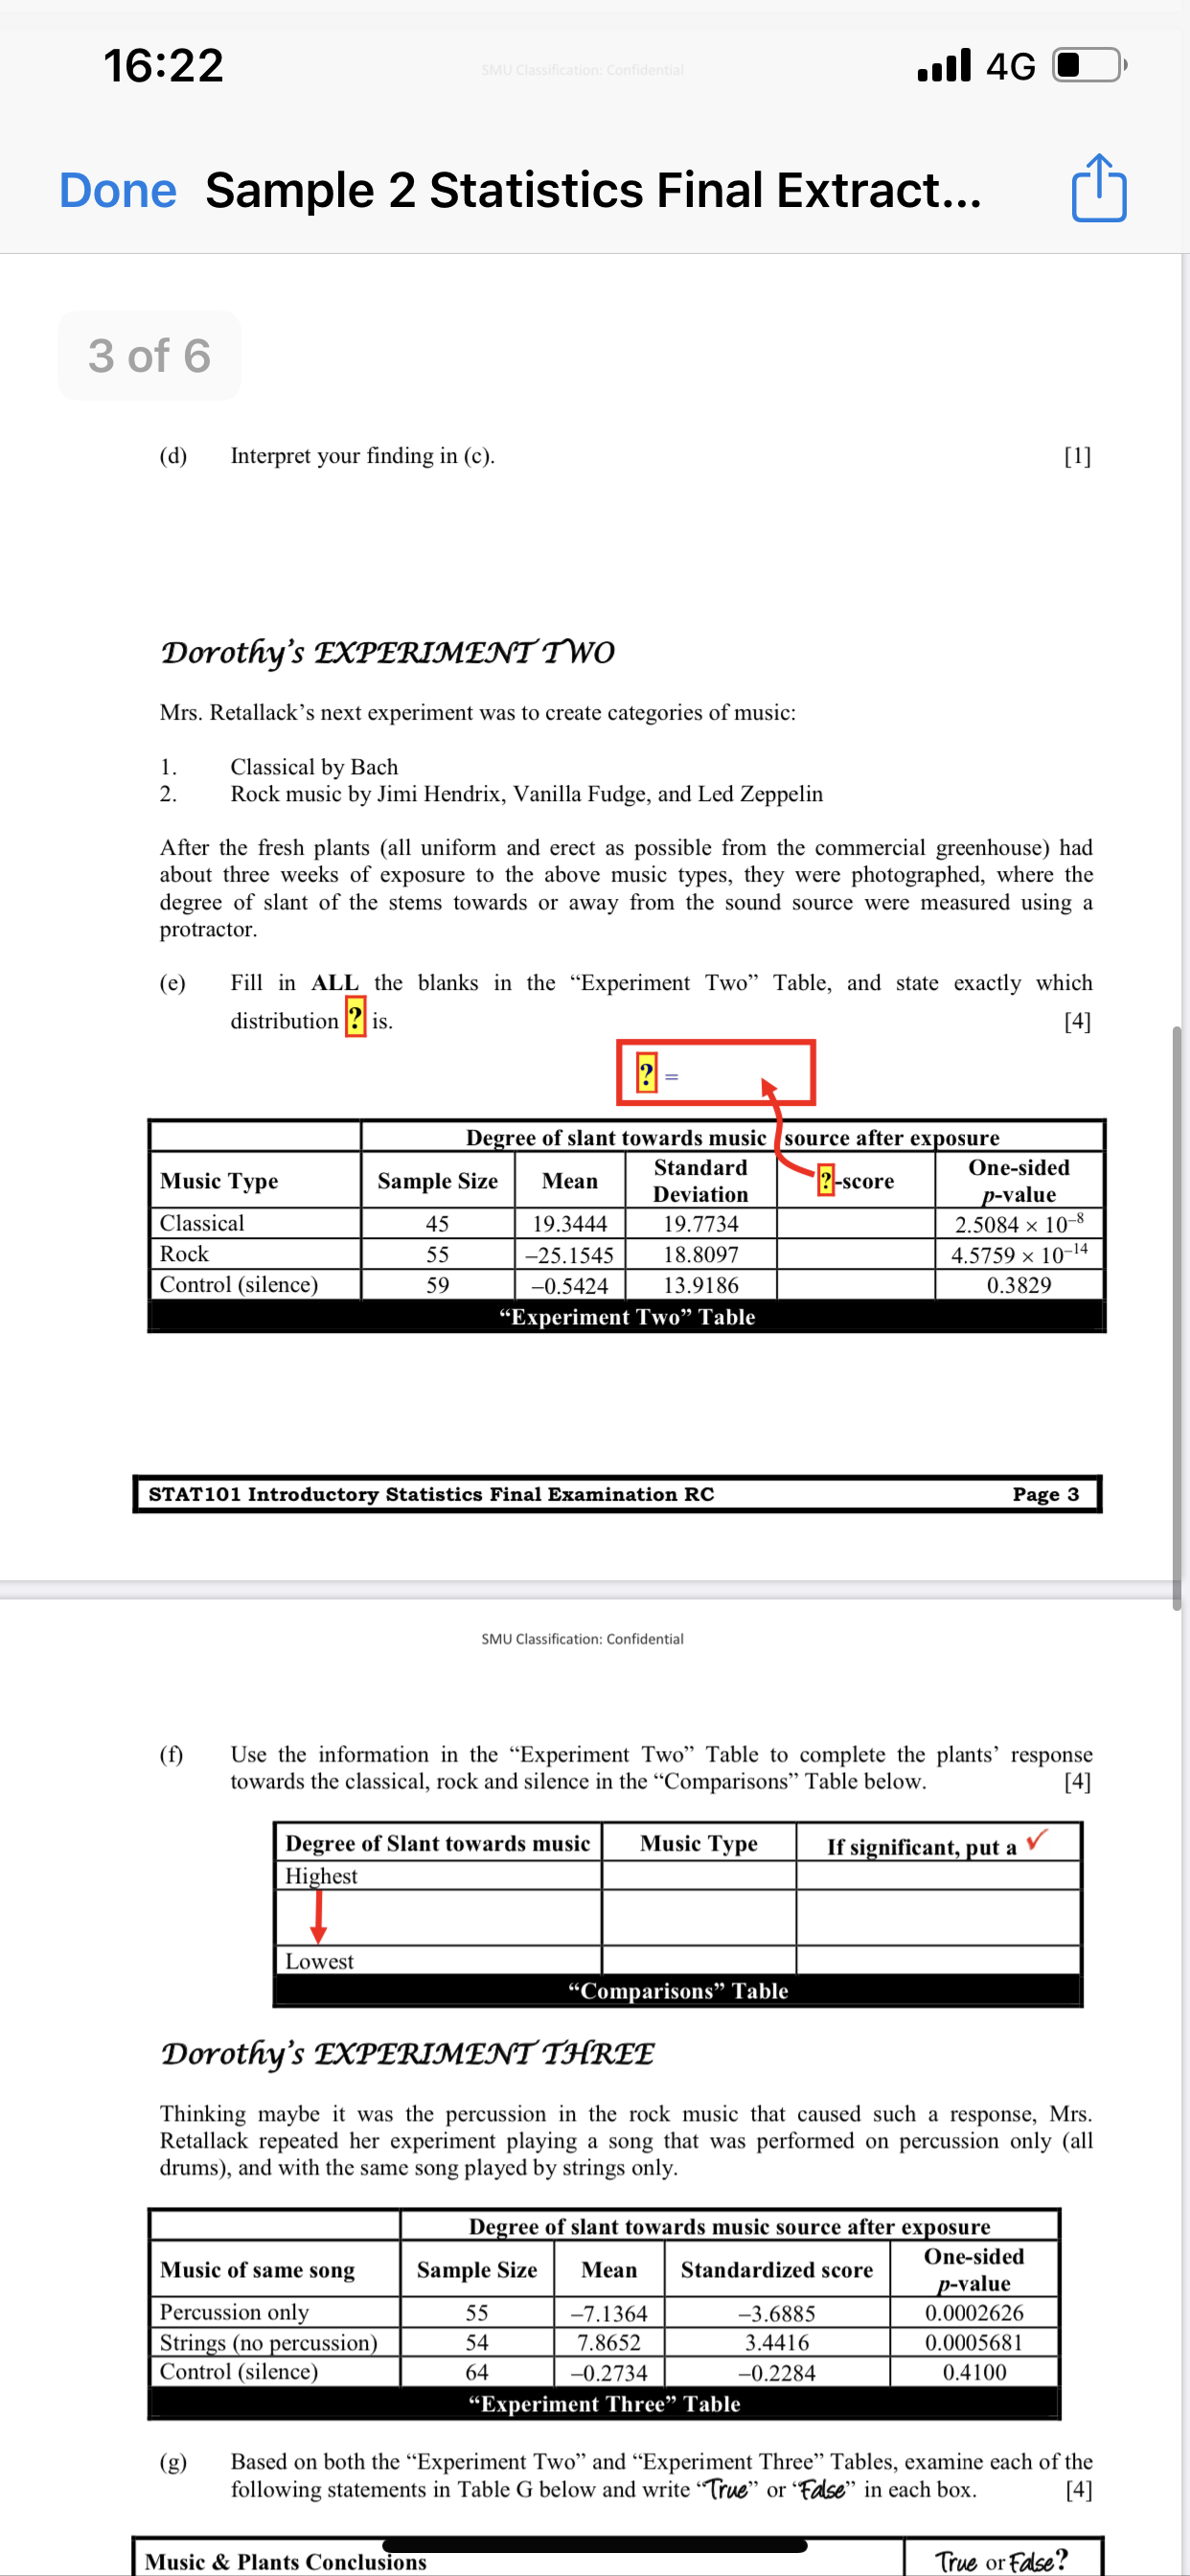
16:22 SMU Classification: Confidential .all 4G Done Sample 2 Statistics Final Extract... 3 of 6 (d) Interpret your finding in (c). [1] Dorothy's EXPERIMENT TWO Mrs. Retallack's next experiment was to create categories of music: Classical by Bach N Rock music by Jimi Hendrix, Vanilla Fudge, and Led Zeppelin After the fresh plants (all uniform and erect as possible from the commercial greenhouse) had about three weeks of exposure to the above music types, they were photographed, where the degree of slant of the stems towards or away from the sound source were measured using a protractor. (e) Fill in ALL the blanks in the "Experiment Two" Table, and state exactly which distribution ? is. [4] Degree of slant towards music source after exposure Music Type Sample Size Mean Standard One-sided Deviation 2-score p-value Classical 45 19.3444 19.7734 2.5084 x 10⁻⁸ Rock 55 -25.1545 18.8097 4.5759 x 10⁻¹⁴ Control (silence) 59 -0.5424 13.9186 0.3829 "Experiment Two" Table STAT101 Introductory Statistics Final Examination RC Page 3 SMU Classification: Confidential (f ) Use the information in the "Experiment Two" Table to complete the plants' response towards the classical, rock and silence in the "Comparisons" Table below. [4] Degree of Slant towards music Music Type If significant, put a V Highest Lowest "Comparisons" Table Dorothy's EXPERIMENT THREE Thinking maybe it was the percussion in the rock music that caused such a response, Mrs. Retallack repeated her experiment playing a song that was performed on percussion only (all drums), and with the same song played by strings only. Degree of slant towards music source after exposure Music of same song Sample Size Mean Standardized score One-sided p-value Percussion only 55 -7.1364 -3.6885 0.0002626 Strings (no percussion) 54 7.8652 3.4416 ).0005681 Control (silence) 64 -0.2734 -0.2284 0.4100 "Experiment Three" Table (g) Based on both the "Experiment Two" and "Experiment Three" Tables, examine each of the following statements in Table G below and write "True" or "False" in each box. [4] Music & Plants Conclusions True or False
Step by Step Solution
There are 3 Steps involved in it

Get step-by-step solutions from verified subject matter experts