

Question: Can I get a step by step process on how to answer questions 8 - 1 5 through in excel? Forecasting Case Analysis MGT 3
Can I get a step by step process on how to answer questions through in excel? Forecasting Case Analysis
MGT
Important Notice: All team members must do all parts of the project and compare results.
DO NOT divide up parts of the project as many parts are related. Teams must submit a copy
of Word file and Excel file of their work through Blackboard Dropbox. Do not submit any
file until all team members agree on the deliverables. Only one team member will submit the
files. There is no second chance on submittal. Post names of all contributing team members
on top of Word file.
The Fresh Detergent Case
Enterprise Industries produces Fresh, a brand of liquid detergent. In order to more effectively
manage its inventory, the company would like to better predict demand for Fresh. To develop a
prediction model, the company has gathered data conceming demand for Fresh over the last
sales periods. Each sales period is defined as one month. The variables are as follows:
Period Time period in month
Demand Y demand for a large size bottle of Fresh in
Price the price of Fresh as offered by Ent. Industries
AIP the Average Industry Price
ADV Enterprise Industries Advertising Expenditure in $ to Promote Fresh in the
sales period.
DIFF AIP Price the "price difference" in the sales period
Download the data from Course Blackboard site into Excel spreadsheet.
Make time series scatter plots of all five variables five graphs Insert trend line, equation, and
Rsquared. Observe graphs and provide interpretation.
Construct scatter plots of Demand vs DIFF and Demand vs ADV, Demand vs AIP, and
Demand vs Price. Insert fitted line, equation, and Rsquared. Observe graphs and provide
interpretation. Note that Demand is always on the Y axis.
Obtain the correlation matrix for all six variables and rank the variables that have strong
correlation with Demand must use absolute value. Explain your findings in plain language.
Use month and month moving averages to predict the demand for October Find
MAD for both forecasts and identify the preferred one based on each calculation. Is the moving
average suitable method for forecasting for this data set? Explain your reasoning.
Use Exponential smoothing forecasts with alpha of dots, to predict October
demand. Identify the value of alpha that results in the lowest MAD.
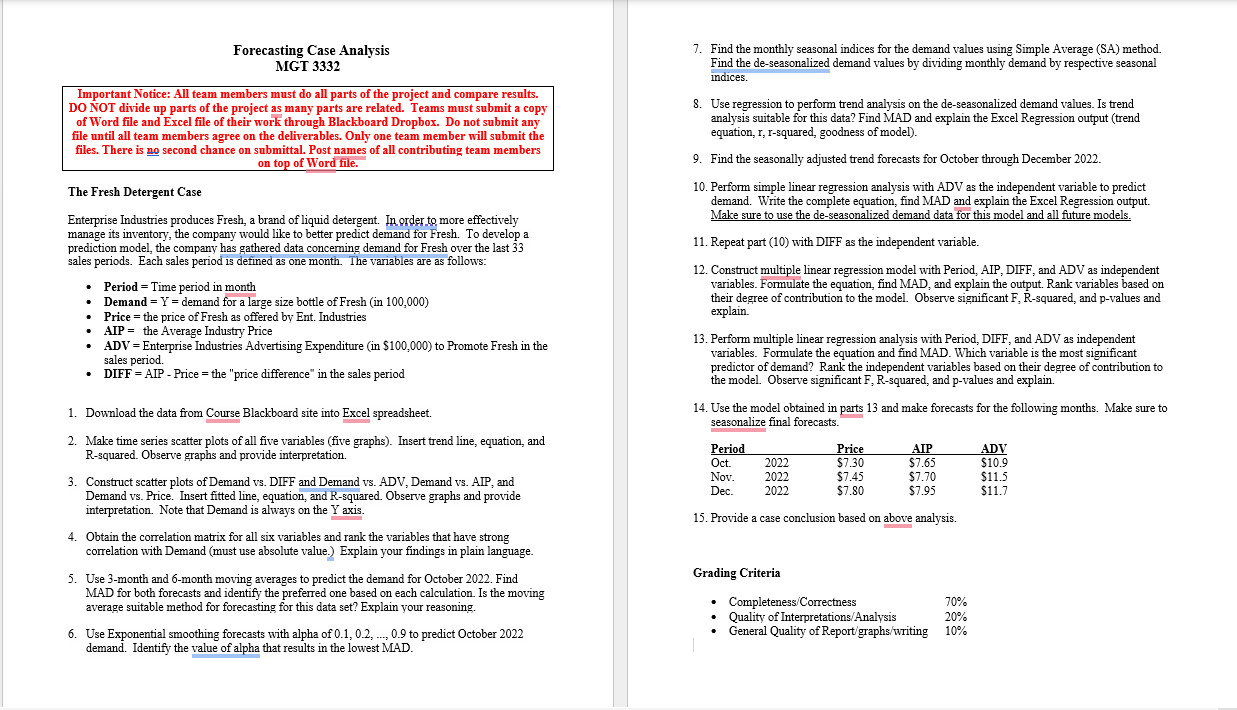
Find the monthly seasonal indices for the demand values using Simple Average SA method.
Find the deseasonalized demand values by dividing monthly demand by respective seasonal
indices.
Use regression to perform trend analysis on the deseasonalized demand values. Is trend
analysis suitable for this data? Find MAD and explain the Excel Regression output trend
equation, r rsquared, goodness of model
Find the seasonally adjusted trend forecasts for October through December
Perform simple linear regression analysis with ADV as the independent variable to predict
demand. Write the complete equation, find MAD and explain the Excel Regression output.
Make sure to use the deseasonalized demand data for this model and all future models.
Repeat part with DIFF as the independent variable.
Construct multiple linear regression model with Period, AIP, DIFF, and ADV as independent
variables. Formulate the equation, find MAD, and explain the output. Rank variables based on
their degree of contribution to the model. Observe significant F Rsquared, and pvalues and
explain.
Perform multiple linear regression analysis with Period, DIFF, and ADV as independent
variables. Formulate the equation and find MAD. Which variable is the most significant
predictor of demand? Rank the independent variables based on their degree of contribution to
the model. Observe significant Rsquared, and p values and explain.
Use the model obtained in parts and make forecasts for the following months. Make sure to
seasonalize final forecasts.
Provide a case conclusion based on above analysis.
Grading Criteria
CompletenessCorrectness
Quality of InterpretationsAnalysis
General Quality of Reportgraphswriting
Step by Step Solution
There are 3 Steps involved in it
1 Expert Approved Answer
Step: 1 Unlock

Question Has Been Solved by an Expert!
Get step-by-step solutions from verified subject matter experts
Step: 2 Unlock
Step: 3 Unlock