

Question: Can I get help? as soon as possible please? it is minitab Problem No. 5 (Computer/Minitab) An experiment was run in a semiconductor fabrication plant
Can I get help? as soon as possible please? it is minitab
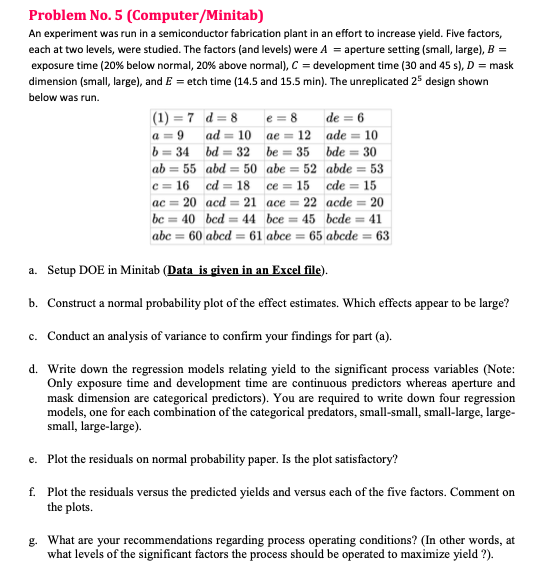
Problem No. 5 (Computer/Minitab) An experiment was run in a semiconductor fabrication plant in an effort to increase yield. Five factors, each at two levels, were studied. The factors (and levels) were A = aperture setting (small, large), B = exposure time (20% below normal, 20% above normal], C = development time (30 and 45 s), D = mask dimension (small, large), and E = etch time (14.5 and 15.5 min). The unreplicated 25 design shown below was run. (1) =7 d=8 e = 8 de = 6 a = 9 ad = 10 ae = 12 ade = 10 b = 34 bd = 32 be = 35 bde = 30 ab = 55 abd = 50 abe = 52 abde = 53 c = 16 ed = 18 ce = 15 cde = 15 ac = 20 acd = 21 ace = 22 acde = 20 be = 40 bed = 44 bee = 45 bode = 41 abc = 60 abcd = 61 abce = 65 abcde = 63 a. Setup DOE in Minitab (Data is given in an Excel file). b. Construct a normal probability plot of the effect estimates. Which effects appear to be large? c. Conduct an analysis of variance to confirm your findings for part (a). d. Write down the regression models relating yield to the significant process variables (Note: Only exposure time and development time are continuous predictors whereas aperture and mask dimension are categorical predictors). You are required to write down four regression models, one for each combination of the categorical predators, small-small, small-large, large- small, large-large). e. Plot the residuals on normal probability paper. Is the plot satisfactory? f. Plot the residuals versus the predicted yields and versus each of the five factors. Comment on the plots. g. What are your recommendations regarding process operating conditions? (In other words, at what levels of the significant factors the process should be operated to maximize yield ?)
Step by Step Solution
There are 3 Steps involved in it

Get step-by-step solutions from verified subject matter experts