

Question: can i get help with this problem please Income Statement Exchange rate used is that of the Year End reported date As Reported Annual Income
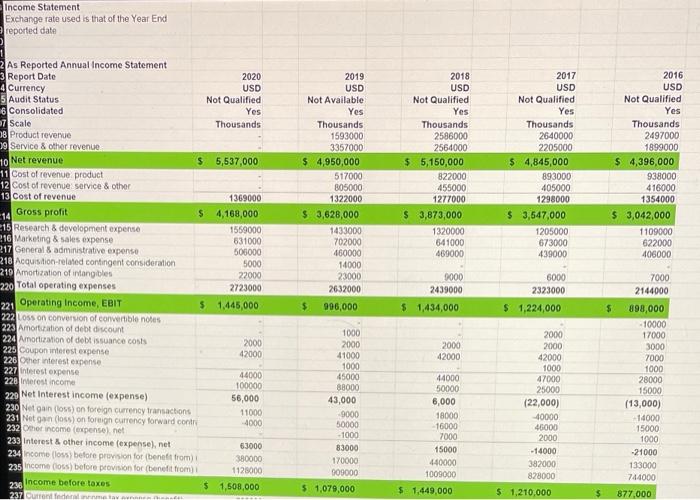
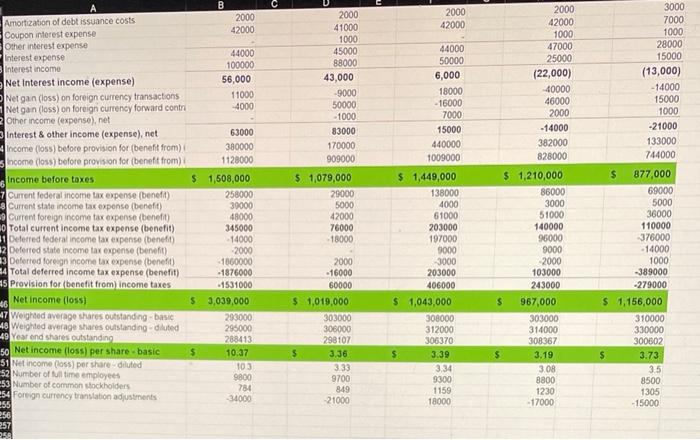
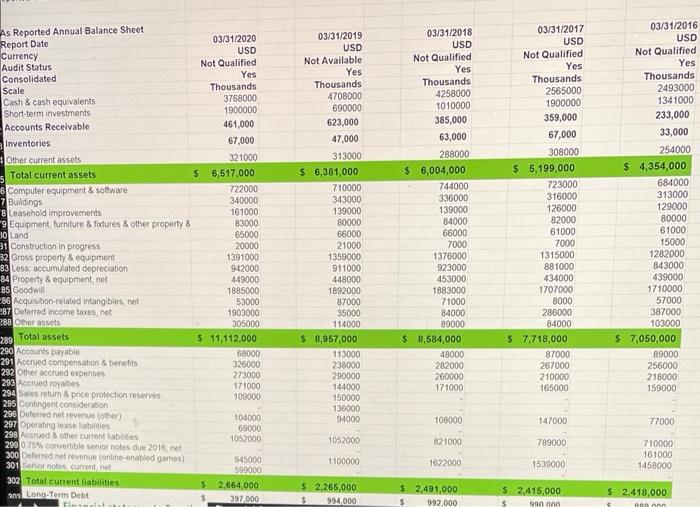
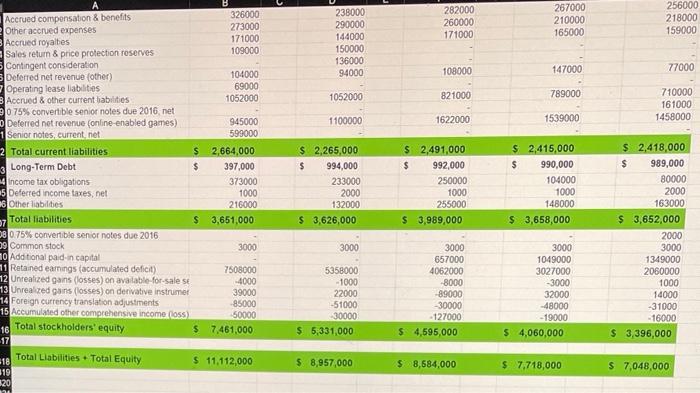
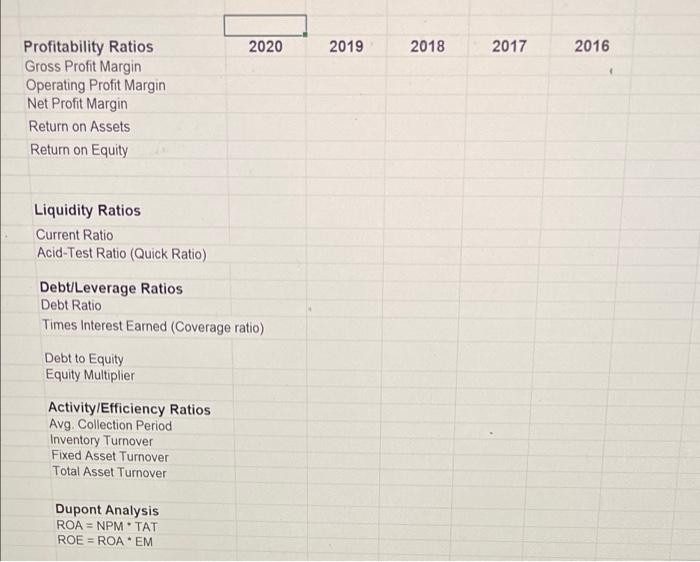
Income Statement Exchange rate used is that of the Year End reported date As Reported Annual Income Statement Report Date Currency Audit Status 6 Consolidated 57 Scale 08 Product revenue 09 Service & other revenue 10 Net revenue 11 Cost of revenue product 12 Cost of revenue: service & other 13 Cost of revenue 14 Gross profit 15 Research & development expense 216 Marketing & sales expense 217 General & administrative expense 218 Acquisition-related contingent consideration 219 Amortization of intangibles 220 Total operating expenses 221 Operating Income, EBIT 222 Loss on conversion of convertible notes 223 Amortization of debt discount 224 Amortization of debt issuance costs 225 Coupon interest expense 226 Other interest expense 227 interest expense 228 Interest income 229 Net Interest income (expense) 230 Net gain (loss) on foreign currency transactions 231 Net gain (loss) on foreign currency forward contri 232 Other income (expense), net 233 Interest & other income (expense), net 234 Income (loss) before provision for (benefit from) i 235 Income (loss) before provision for (benefit from) i 236 Income before taxes $ 237 Current federal aneme tavenanam hamadas 2020 USD Not Qualified Yes Thousands $ 5,537,000 1369000 $ 4,168,000 1559000 631000 506000 5000 22000 2723000 $ 1,445,000 2000 42000 44000 100000 56,000 11000 -4000 63000 380000 1128000 1,508,000 2019 USD Not Available Yes Thousands 1593000 3357000 $ 4,950,000 517000 805000 1322000 $ 3,628,000 1433000 702000 460000 14000 23000 2632000 $ 996,000 1000 2000 41000 1000 45000 88000 43,000 -9000 50000 -1000 83000 170000 009000 $ 1,079,000 2018 USD Not Qualified Yes Thousands 2586000 2564000 $ 5,150,000 822000 455000 1277000 $ 3,873,000 00 641000 469000 9000 2439000 $ 1,434,000 2000 42000 44000 50000 6,000 18000 16000 7000 15000 440000 1000000 $ 1,449,000 2017 USD Not Qualified Yes Thousands 2640000 2205000 $ 4,845,000 893000 405000 1298000 $ 3,547,000 1205000 673000 439000 6000 2323000 $ 1,224,000 2000 2000 42000 1000 47000 25000 (22,000) -40000 46000 2000 -14000 382000 828000 $ 1,210,000 $ $ 2016 USD Not Qualified Yes Thousands 2497000 1899000 $ 4,396,000 938000 416000 1354000 $ 3,042,000 1109000 622000 406000 7000 2144000 898,000 -10000 17000 3000 7000 1000 28000 15000 (13,000) +14000 15000 1000 -21000 133000 744000 877,000 Amortization of debt issuance costs Coupon interest expense Other interest expense Interest expense Interest income Net Interest income (expense) ONet gain (loss) on foreign currency transactions Net gain (loss) on foreign currency forward contri Other income (expense), net 2 3 Interest & other income (expense), net Income (loss) before provision for (benefit from) Income (loss) before provision for (benefit from) i Income before taxes $ 7 Current federal income tax expense (benefit) 8 Current state income tax expense (benefit) 19 Current foreign income tax expense (benefit) 0 Total current income tax expense (benefit) 31 Deferred federal income tax expense (benefit) 32 Deferred state income tax expense (benefit) 3 Deferred foreign income tax expense (benefit) 4 Total deferred income tax expense (benefit) 45 Provision for (benefit from) income taxes Net income (loss) 46 47 Weighted average shares outstanding-basic 48 Weighted average shares outstanding-diluted 49 Year end shares outstanding 50 Net income (loss) per share-basic 51 Net income (loss) per share-diluted 52 Number of full time employees 53 Number of common stockholders 54 Foreign currency translation adjustments 255 256 257 258 B 2000 42000 44000 100000 56,000 11000 -4000 63000 380000 1128000 1,508,000 258000 30000 48000 345000 -14000 -2000 -1060000 -1876000 -1531000 $ 3,039,000 293000 295000 288413 $ 10.37 103 9800 784 34000 2000 41000 1000 45000 88000 43,000 -9000 50000 -1000 83000 170000 909000 $ 1,079,000 29000 5000 42000 76000 -18000 2000 -16000 60000 $ 1,019,000 303000 306000 298107 $ 3.36 3.33 9700 849 -21000 2000 42000 44000 50000 6,000 18000 -16000 7000 15000 440000 1009000 $ 1,449,000 138000 4000 61000 203000 197000 9000 -3000 203000 406000 $ 1,043,000 308000 312000 306370 $ 3.39 3,34 9300 1159 18000 S $ 2000 42000 1000 47000 25000 (22,000) -40000 46000 2000 -14000 382000 828000 $ 1,210,000 86000 3000 51000 140000 96000 9000 -2000 103000 243000 967,000 303000 314000 308367 3.19 3.08 8800 1230 -17000 $ 3000 7000 1000 28000 15000 (13,000) -14000 15000 1000 -21000 133000 744000 877,000 69000 5000 36000 110000 -376000 -14000 1000 -389000 -279000 $ 1,156,000 310000 330000 300602 $ 3.73 3.5 8500 1305 -15000 As Reported Annual Balance Sheet Report Date Currency Audit Status Consolidated Scale Cash & cash equivalents Short-term investments Accounts Receivable Inventories Other current assets Total current assets 6 Computer equipment & software 7 Buildings 8 Leasehold improvements 9 Equipment, furniture & fixtures & other property & 30 Land 31 Construction in progress 32 Gross property & equipment 83 Less: accumulated depreciation 84 Property & equipment, net 85 Goodwill 86 Acquisition-related intangibles, net 287 Deferred income taxes, net 288 Other assets Total assets 289 290 Accounts payable 291 Accrued compensation & benefits 292 Other accrued expenses 293 Accrued royalties 294 Sales return & price protection reserves 295 Contingent consideration 296 Deferred net revenue (other) 297 Operating lease liabilites 298 Accrued & other current liabilites 299 0 75% convertible senior notes due 2016, net 300 Deferred net revenue (online-enabled games) 301 Serior notes, current, net 302 Total current liabilities ans Long-Term Debt Einar 03/31/2020 USD Not Qualified Yes Thousands 3768000 1900000 461,000 67,000 321000 $ 6,517,000 722000 340000 161000 83000 65000 20000 1391000 942000 449000 1885000 53000 1903000 305000 $ 11,112,000 68000 326000 273000 171000 109000 104000 69000 1052000 945000 599000 2,664,000 397,000 S 03/31/2019 USD Not Available Yes Thousands 4708000 690000 623,000 47,000 313000 $ 6,381,000 710000 343000 139000 80000 66000 21000 1359000 911000 448000 1892000 87000 35000 114000 $ 8,957,000 113000 238000 290000 144000 150000 136000 94000 1052000 1100000 $ 2,265,000 $ 994,000 03/31/2018 USD Not Qualified Yes Thousands 4258000 1010000 385,000 63,000 288000 $ 6,004,000 744000 336000 139000 84000 66000 7000 1376000 923000 453000 1883000 71000 84000 89000 $ 8,584,000 48000 282000 260000 171000 108000 821000 1622000 $ 2,491,000 $ 992,000 03/31/2017 USD Not Qualified Yes Thousands 2565000 1900000 359,000 67,000 308000 $ 5,199,000 723000 316000 126000 82000 61000 7000 1315000 881000 434000 1707000 8000 286000 84000 $ 7,718,000 87000 267000 210000 165000 147000 789000 1539000 $ 2,415,000 S 990 000 03/31/2016 USD Not Qualified Yes Thousands 2493000 1341000 233,000 33,000 254000 $ 4,354,000 684000 313000 129000 80000 61000 15000 1282000 843000 439000 1710000 57000 387000 103000 $ 7,050,000 89000 256000 218000 159000 77000 710000 161000 1458000 $ 2,418,000 090 000 B 326000 Accrued compensation & benefits Other accrued expenses 273000 Accrued royalties 171000 109000 Sales return & price protection reserves Contingent consideration 104000 Deferred net revenue (other) Operating lease liabilities 69000 Accrued & other current babilities 1052000 0 75% convertible senior notes due 2016, net O Deferred net revenue (online-enabled games) 945000 599000 1 Senior notes, current, net 2 Total current liabilities $ 2,664,000 Long-Term Debt $ 397,000 4 Income tax obligations 373000 5 Deferred income taxes, net 6 Other liabilities 1000 216000 3,651,000 Total liabilities $ 08 0.75% convertible senior notes due 2016 09 Common stock 3000 0 Additional paid-in capital 11 Retained earnings (accumulated deficit) 7508000 12 Unrealized gains (losses) on available-for-sale se -4000 13 Unrealized gains (losses) on derivative instrumer 39000 14 Foreign currency translation adjustments 15 Accumulated other comprehensive income (loss) Total stockholders' equity -85000 -50000 7,461,000 16 $ 17 Total Liabilities Total Equity + 18 $ 11,112,000 19 20 m 238000 290000 144000 150000 136000 94000 1052000 1100000 $ 2,265,000 $ 994,000 233000 2000 132000 $ 3,626,000 3000 5358000 -1000 22000 -51000 -30000 $ 5,331,000 $ 8,957,000 282000 260000 171000 108000 821000 1622000 $ 2,491,000 $ 992,000 250000 1000 255000 $ 3,989,000 3000 657000 4062000 -8000 -89000 -30000 -127000 $4,595,000 $ 8,584,000 267000 210000 165000 147000 789000 1539000 $ 2,415,000 $ 990,000 104000 1000 148000 $ 3,658,000 3000 1049000 3027000 -3000 32000 -48000 -19000 $ 4,060,000 $7,718,000 256000 218000 159000 77000 710000 161000 1458000 $ 2,418,000 $ 989,000 80000 2000 163000 $ 3,652,000 2000 3000 1349000 2060000 1000 14000 -31000 -16000 $ 3,396,000 $ 7,048,000 Profitability Ratios Gross Profit Margin Operating Profit Margin Net Profit Margin Return on Assets Return on Equity Liquidity Ratios Current Ratio Acid-Test Ratio (Quick Ratio) Debt/Leverage Ratios Debt Ratio Times Interest Earned (Coverage ratio) Debt to Equity Equity Multiplier Activity/Efficiency Ratios Avg. Collection Period Inventory Turnover Fixed Asset Turnover Total Asset Turnover Dupont Analysis ROA NPM TAT ROEROA EM 2020 2019 2018 2017 2016
Step by Step Solution
There are 3 Steps involved in it

Get step-by-step solutions from verified subject matter experts