

Question: Can I get part D answered please? Question 1: Segment analysis (Notes to the financial statements, Note 2.7) (25 marks) (a) Identify the most and
 Can I get part D answered please?
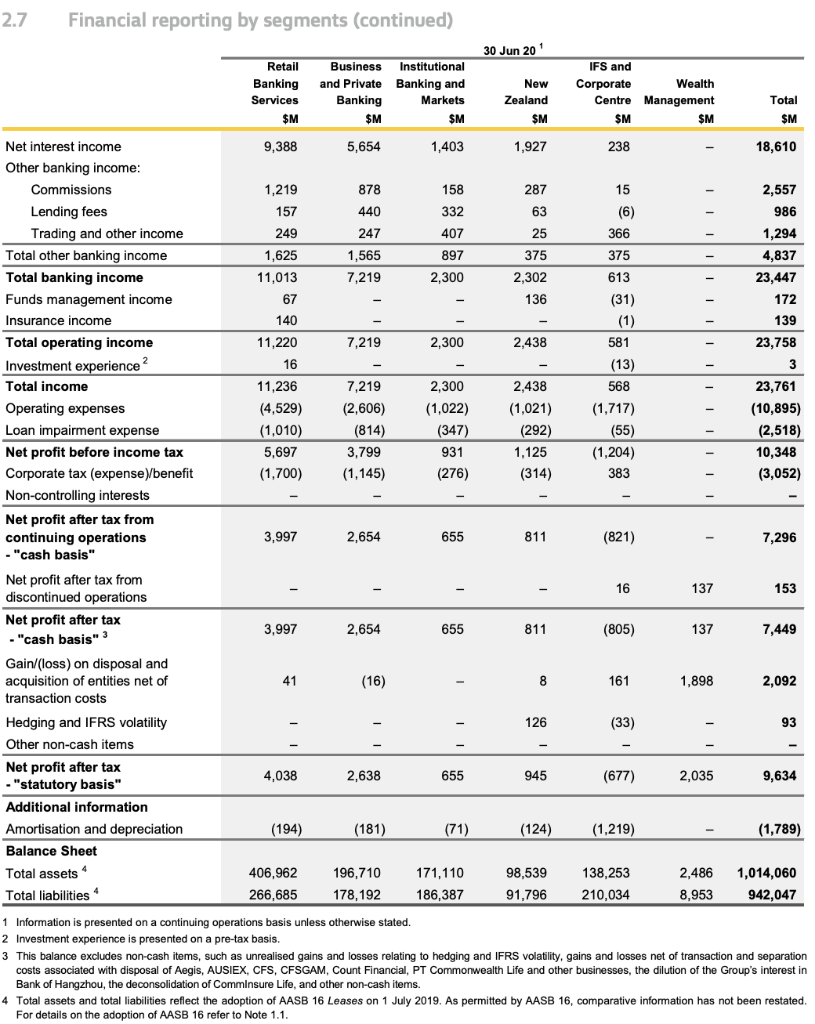
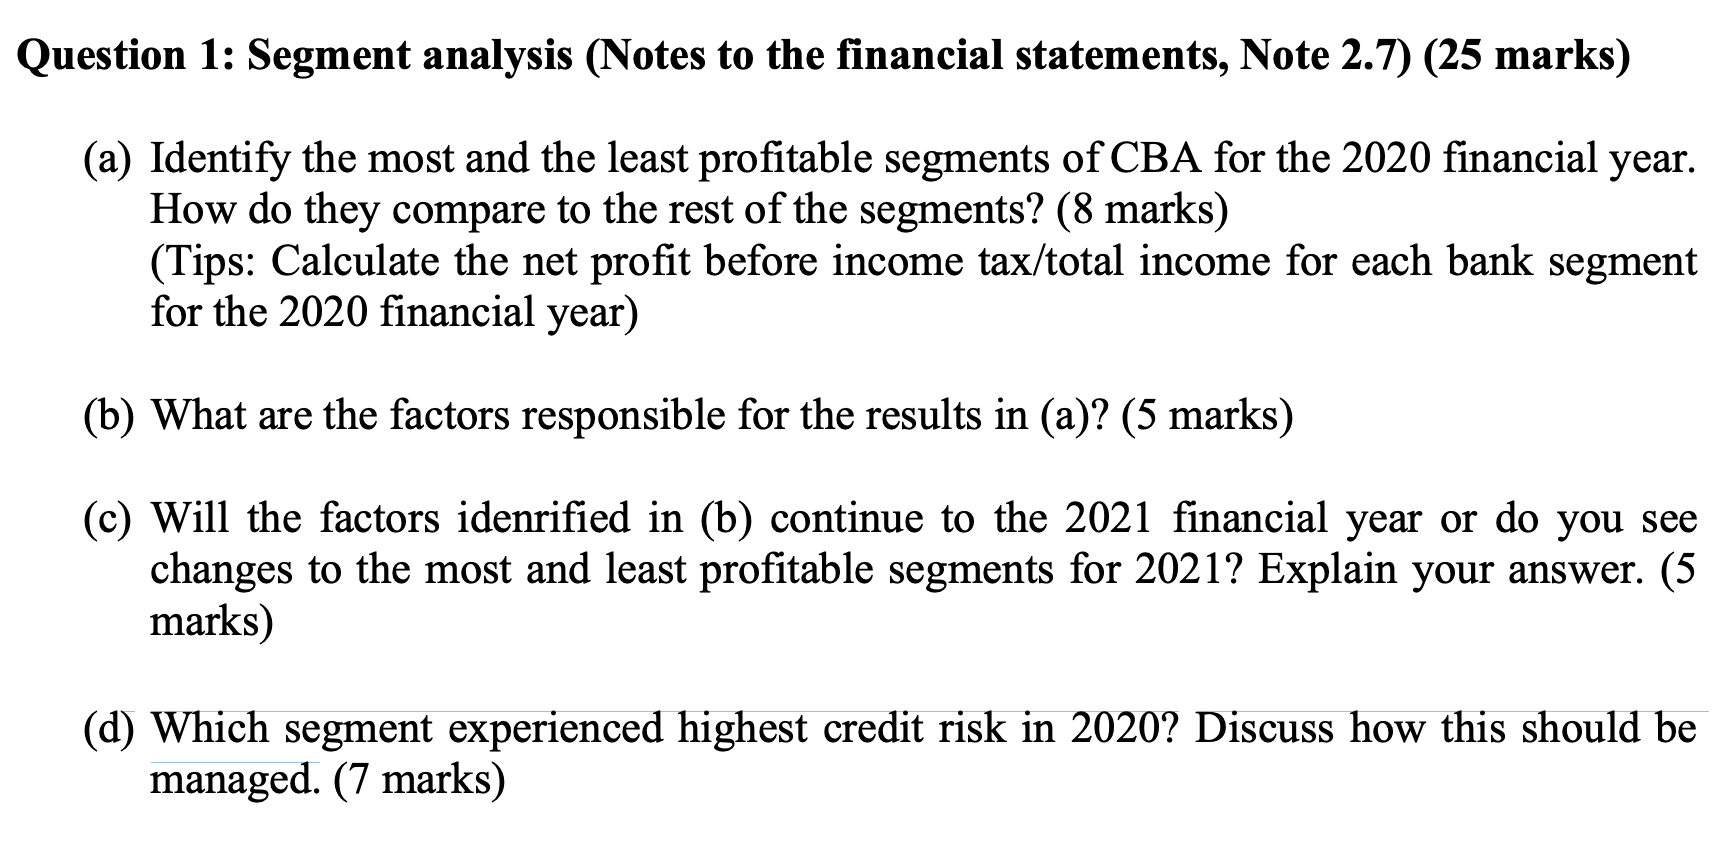
Question 1: Segment analysis (Notes to the financial statements, Note 2.7) (25 marks) (a) Identify the most and the least profitable segments of CBA for the 2020 financial year. How do they compare to the rest of the segments? (8 marks) (Tips: Calculate the net profit before income tax/total income for each bank segment for the 2020 financial year) (b) What are the factors responsible for the results in (a)? (5 marks) (c) Will the factors idenrified in (b) continue to the 2021 financial year or do you see changes to the most and least profitable segments for 2021? Explain your answer. (5 marks) (d) Which segment experienced highest credit risk in 2020? Discuss how this should be managed. (7 marks) 2.7 Financial reporting by segments (continued) 30 Jun 20 Retail Banking Services $M Business Institutional and Private Banking and Banking Markets $M $M New Zealand IFS and Corporate Wealth Centre Management SM $M Total SM SM 1,294 (4,529) Net interest income 9,388 5,654 1,403 1,927 238 18,610 Other banking income: Commissions 1,219 878 158 287 15 2,557 Lending fees 157 440 332 63 (6) 986 Trading and other income 249 247 407 25 366 Total other banking income 1,625 1,565 897 375 375 4,837 Total banking income 11,013 7,219 2,300 2,302 613 23,447 Funds management income 67 136 (31) 172 Insurance income 140 (1) 139 Total operating income 11,220 7,219 2,300 2,438 581 23,758 Investment experience ? 16 (13) 3 Total income 11,236 7,219 2,300 2,438 568 23,761 Operating expenses (2,606) (1,022) (1,021) (1,717) (10,895) Loan impairment expense (1,010) (814) (347) (292) (55) (2,518) Net profit before income tax 5,697 3,799 931 1.125 (1,204) 10,348 Corporate tax (expense benefit (1,700) (1,145) (276) (314) 383 (3,052) Non-controlling interests Net profit after tax from continuing operations 3,997 2,654 655 811 (821) 7,296 - "cash basis" Net profit after tax from discontinued operations 16 137 153 Net profit after tax 3,997 2,654 655 811 (805) 137 -"cash basis" 3 7,449 Gain/(loss) on disposal and acquisition of entities net of 41 (16) 8 161 1,898 2,092 transaction costs Hedging and IFRS volatility 126 (33) 93 Other non-cash items Net profit after tax 4,038 2,638 655 945 - "statutory basis" (677) 2,035 9,634 Additional information Amortisation and depreciation (194) (181) (71) (124) (1.219) (1,789) Balance Sheet Total assets 406,962 196,710 171,110 98,539 138,253 2,486 1,014,060 Total liabilities 266,685 178,192 186,387 91,796 210,034 8,953 942,047 1 Information is presented on a continuing operations basis unless otherwise stated. 2 Investment experience is presented on a pre-tax basis. 3 This balance excludes non-cash items, such as unrealised gains and losses relating hedging and IFRS volatility, gains and losses net of transaction and separation costs associated with disposal of Aegis, AUSIEX, CFS, CFSGAM, Count Financial, PT Commonwealth Life and other businesses, the dilution of the Group's interest in Bank of Hangzhou, the deconsolidation of CommInsure Life, and other non-cash items. 4 Total assets and total liabilities reflect the adoption of AASB 16 Leases on 1 July 2019. As permitted by AASB 16, comparative information has not been restated. For details on the adoption of AASB 16 refer to Note 1.1. - - - - - Question 1: Segment analysis (Notes to the financial statements, Note 2.7) (25 marks) (a) Identify the most and the least profitable segments of CBA for the 2020 financial year. How do they compare to the rest of the segments? (8 marks) (Tips: Calculate the net profit before income tax/total income for each bank segment for the 2020 financial year) (b) What are the factors responsible for the results in (a)? (5 marks) (c) Will the factors idenrified in (b) continue to the 2021 financial year or do you see changes to the most and least profitable segments for 2021? Explain your answer. (5 marks) (d) Which segment experienced highest credit risk in 2020? Discuss how this should be managed. (7 marks) 2.7 Financial reporting by segments (continued) 30 Jun 20 Retail Banking Services $M Business Institutional and Private Banking and Banking Markets $M $M New Zealand IFS and Corporate Wealth Centre Management SM $M Total SM SM 1,294 (4,529) Net interest income 9,388 5,654 1,403 1,927 238 18,610 Other banking income: Commissions 1,219 878 158 287 15 2,557 Lending fees 157 440 332 63 (6) 986 Trading and other income 249 247 407 25 366 Total other banking income 1,625 1,565 897 375 375 4,837 Total banking income 11,013 7,219 2,300 2,302 613 23,447 Funds management income 67 136 (31) 172 Insurance income 140 (1) 139 Total operating income 11,220 7,219 2,300 2,438 581 23,758 Investment experience ? 16 (13) 3 Total income 11,236 7,219 2,300 2,438 568 23,761 Operating expenses (2,606) (1,022) (1,021) (1,717) (10,895) Loan impairment expense (1,010) (814) (347) (292) (55) (2,518) Net profit before income tax 5,697 3,799 931 1.125 (1,204) 10,348 Corporate tax (expense benefit (1,700) (1,145) (276) (314) 383 (3,052) Non-controlling interests Net profit after tax from continuing operations 3,997 2,654 655 811 (821) 7,296 - "cash basis" Net profit after tax from discontinued operations 16 137 153 Net profit after tax 3,997 2,654 655 811 (805) 137 -"cash basis" 3 7,449 Gain/(loss) on disposal and acquisition of entities net of 41 (16) 8 161 1,898 2,092 transaction costs Hedging and IFRS volatility 126 (33) 93 Other non-cash items Net profit after tax 4,038 2,638 655 945 - "statutory basis" (677) 2,035 9,634 Additional information Amortisation and depreciation (194) (181) (71) (124) (1.219) (1,789) Balance Sheet Total assets 406,962 196,710 171,110 98,539 138,253 2,486 1,014,060 Total liabilities 266,685 178,192 186,387 91,796 210,034 8,953 942,047 1 Information is presented on a continuing operations basis unless otherwise stated. 2 Investment experience is presented on a pre-tax basis. 3 This balance excludes non-cash items, such as unrealised gains and losses relating hedging and IFRS volatility, gains and losses net of transaction and separation costs associated with disposal of Aegis, AUSIEX, CFS, CFSGAM, Count Financial, PT Commonwealth Life and other businesses, the dilution of the Group's interest in Bank of Hangzhou, the deconsolidation of CommInsure Life, and other non-cash items. 4 Total assets and total liabilities reflect the adoption of AASB 16 Leases on 1 July 2019. As permitted by AASB 16, comparative information has not been restated. For details on the adoption of AASB 16 refer to
Step by Step Solution
There are 3 Steps involved in it

Get step-by-step solutions from verified subject matter experts