

Question: Can I get some assistance with a cash flow statement from the following data? 2,490,700 7,400 -18,500 7,000 -4,100 2,486,600 182.200 -122,400 0 59,800 2,426,800
Can I get some assistance with a cash flow statement from the following data?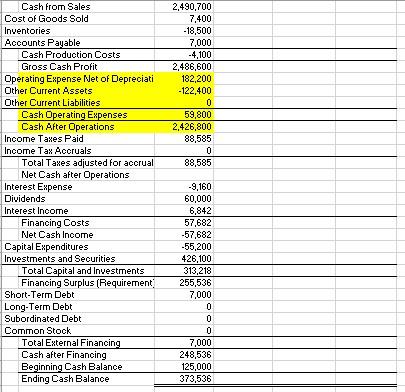
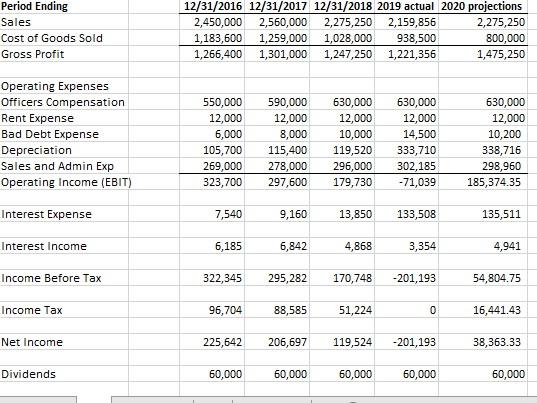
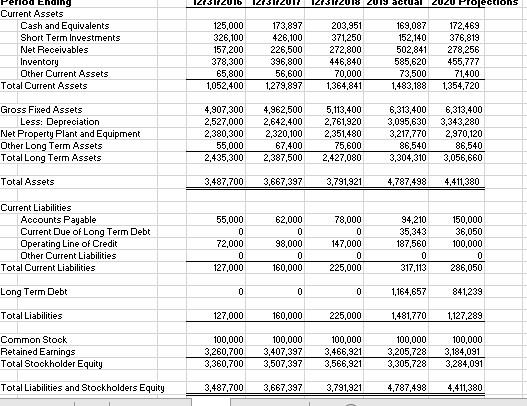
2,490,700 7,400 -18,500 7,000 -4,100 2,486,600 182.200 -122,400 0 59,800 2,426,800 88,585 0 88,585 Cash from Sales Cost of Goods Sold Inventories Accounts Payable Cash Production Costs Gross Cash Profit Operating Expense Net of Depreciati Other Current Assets Other Current Liabilities Cash Operating Expenses Cash After Operations Income Taxes Paid Income Tax Accruals Total Taxes adjusted for accrual Net Cash after Operations Interest Expense Dividends Interest Income Financing Costs Net Cash Income Capital Expenditures Investments and Securities Total Capital and Investments Financing Surplus (Requirement Short-Term Debt Long-Term Debt Subordinated Debt Common Stock Total External Financing Cash after Financing Beginning Cash Balance Ending Cash Balance -9,160 60,000 6,842 57,682 -57,682 -55,200 426,100 313,218 255,536 7,000 0 0 0 7,000 248,536 125,000 373,536 Period Ending Sales Cost of Goods Sold Gross Profit 12/31/2016 12/31/2017 12/31/2018 2019 actual 2020 projections 2,450,000 2,560,000 2,275,250 2,159,856 2,275,250 1,183,600 1,259,000 1,028,000 938,500 800,000 1,266,400 1,301,000 1,247,250 1,221,356 1,475,250 Operating Expenses Officers Compensation Rent Expense Bad Debt Expense Depreciation Sales and Admin Exp Operating Income (EBIT) 550,000 12,000 6,000 105,700 269,000 323,700 590,000 12,000 8,000 115,400 278,000 297,600 630,000 12,000 10,000 119,520 296,000 179,730 630,000 12,000 14,500 333,710 302,185 -71,039 630,000 12,000 10,200 338,716 298,960 185,374.35 Interest Expense 7,540 9,160 13,850 133,508 135,511 Interest Income 6,185 6,842 4,868 3,354 4,941 Income Before Tax 322,345 295,282 170,748 -201,193 54,804.75 Income Tax 96,704 88,585 51,224 0 16,441.43 Net Income 225,642 206,697 119,524 -201,193 38,363.33 Dividends 60,000 60,000 60,000 60,000 60,000 ZUT actual Current Assets Cash and Equivalents Short Term Investments Net Receivables Inventory Other Current Assets Total Current Assets 125,000 326,100 157,200 378,300 65,800 1,052,400 173,897 426,100 226,500 396,800 56,600 1,279,897 203,951 371,250 272,800 446,840 70,000 1,364,841 169,087 152,140 502,841 585,620 73,500 1,483,188 172,469 376,819 278,256 455,777 71,400 1,354,720 Gross Fixed Assets Less: Depreciation Net Property Plant and Equipment Other Long Term Assets Total Long Term Assets 4,907,300 2,527,000 2,380,300 55,000 2,435,300 4,962,500 2,642,400 2,320,100 67,400 2,387,500 5,113,400 2,761,920 2,351,480 75,600 2,427,080 6,313,400 3,095,630 3,217,770 86,540 3,304,310 6,313,400 3,343,280 2,970,120 86,540 3,056,660 Total Assets 3,487,700 3,667,397 3,791,921 4,787,498 4,411,380 Current Liabilities Accounts Payable Current Due of Long Term Debt Operating Line of Credit Other Current Liabilities Total Current Liabilities 55,000 0 72,000 0 127,000 62,000 0 98,000 0 160,000 78,000 0 147,000 0 225,000 94,210 35,343 187,560 0 317,113 150,000 36,050 100,000 0 286,050 Long Term Debt 0 0 0 1,164,657 841,239 Total Liabilities 127,000 160,000 225,000 1,481,770 1,127,289 Common Stock Retained Earnings Total Stockholder Equity 100,000 3,260,700 3,360,700 100,000 3,407,397 3,507,397 100,000 3,466,921 3,566,921 100,000 3,205,728 3,305,728 100,000 3,184,091 3,284,091 Total Liabilities and Stockholders Equity 3,487,700 3,667,397 3,791,921 4,787.498 4,411,380 2,490,700 7,400 -18,500 7,000 -4,100 2,486,600 182.200 -122,400 0 59,800 2,426,800 88,585 0 88,585 Cash from Sales Cost of Goods Sold Inventories Accounts Payable Cash Production Costs Gross Cash Profit Operating Expense Net of Depreciati Other Current Assets Other Current Liabilities Cash Operating Expenses Cash After Operations Income Taxes Paid Income Tax Accruals Total Taxes adjusted for accrual Net Cash after Operations Interest Expense Dividends Interest Income Financing Costs Net Cash Income Capital Expenditures Investments and Securities Total Capital and Investments Financing Surplus (Requirement Short-Term Debt Long-Term Debt Subordinated Debt Common Stock Total External Financing Cash after Financing Beginning Cash Balance Ending Cash Balance -9,160 60,000 6,842 57,682 -57,682 -55,200 426,100 313,218 255,536 7,000 0 0 0 7,000 248,536 125,000 373,536 Period Ending Sales Cost of Goods Sold Gross Profit 12/31/2016 12/31/2017 12/31/2018 2019 actual 2020 projections 2,450,000 2,560,000 2,275,250 2,159,856 2,275,250 1,183,600 1,259,000 1,028,000 938,500 800,000 1,266,400 1,301,000 1,247,250 1,221,356 1,475,250 Operating Expenses Officers Compensation Rent Expense Bad Debt Expense Depreciation Sales and Admin Exp Operating Income (EBIT) 550,000 12,000 6,000 105,700 269,000 323,700 590,000 12,000 8,000 115,400 278,000 297,600 630,000 12,000 10,000 119,520 296,000 179,730 630,000 12,000 14,500 333,710 302,185 -71,039 630,000 12,000 10,200 338,716 298,960 185,374.35 Interest Expense 7,540 9,160 13,850 133,508 135,511 Interest Income 6,185 6,842 4,868 3,354 4,941 Income Before Tax 322,345 295,282 170,748 -201,193 54,804.75 Income Tax 96,704 88,585 51,224 0 16,441.43 Net Income 225,642 206,697 119,524 -201,193 38,363.33 Dividends 60,000 60,000 60,000 60,000 60,000 ZUT actual Current Assets Cash and Equivalents Short Term Investments Net Receivables Inventory Other Current Assets Total Current Assets 125,000 326,100 157,200 378,300 65,800 1,052,400 173,897 426,100 226,500 396,800 56,600 1,279,897 203,951 371,250 272,800 446,840 70,000 1,364,841 169,087 152,140 502,841 585,620 73,500 1,483,188 172,469 376,819 278,256 455,777 71,400 1,354,720 Gross Fixed Assets Less: Depreciation Net Property Plant and Equipment Other Long Term Assets Total Long Term Assets 4,907,300 2,527,000 2,380,300 55,000 2,435,300 4,962,500 2,642,400 2,320,100 67,400 2,387,500 5,113,400 2,761,920 2,351,480 75,600 2,427,080 6,313,400 3,095,630 3,217,770 86,540 3,304,310 6,313,400 3,343,280 2,970,120 86,540 3,056,660 Total Assets 3,487,700 3,667,397 3,791,921 4,787,498 4,411,380 Current Liabilities Accounts Payable Current Due of Long Term Debt Operating Line of Credit Other Current Liabilities Total Current Liabilities 55,000 0 72,000 0 127,000 62,000 0 98,000 0 160,000 78,000 0 147,000 0 225,000 94,210 35,343 187,560 0 317,113 150,000 36,050 100,000 0 286,050 Long Term Debt 0 0 0 1,164,657 841,239 Total Liabilities 127,000 160,000 225,000 1,481,770 1,127,289 Common Stock Retained Earnings Total Stockholder Equity 100,000 3,260,700 3,360,700 100,000 3,407,397 3,507,397 100,000 3,466,921 3,566,921 100,000 3,205,728 3,305,728 100,000 3,184,091 3,284,091 Total Liabilities and Stockholders Equity 3,487,700 3,667,397 3,791,921 4,787.498 4,411,380
Step by Step Solution
There are 3 Steps involved in it

Get step-by-step solutions from verified subject matter experts