

Question: Can I have help with solving this is MatLab? I get how to set up a function but I am very confused with Eulers Method
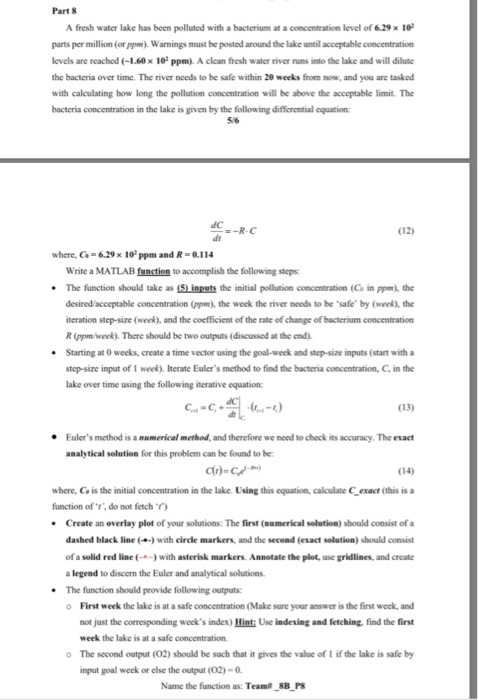
Part 8 A fresh water lake has been polluted with a bacterium at a concentration level of 629 x 10 parts per million (or ppm). Warnings must be posted around the lake until acceptable concentration levels are reached (-1.60 x 10 ppm). A clean fresh water river runs into the lake and will dilute the bacteria over time. The river needs to be safe within 20 weeks from now, and you are tasked with calculating how long the pollution concentration will be above the acceptable limit. The bacteria concentration in the lake is given by the following diffierential cquation: 56 dC =-R-C (12) where, C-6.29 x 10: ppm and R 0.1 14 Write a MATLAB function to accomplish the following The function should take as LSLnputs the initial pollution concentration C, in ppm), the desired acceptable concentration (ppm), the week the river needs to be "safe by (week), the iteration step-size (week), and the coefficient of the rate of change of bacterium concentration R (ppm/week). There should be two outputs (discussed at the end) .Starting at 0 weeks, create a time vector using the goal-week and step-size inputs (start with a step-size input of I week). Iterate Euler's method to find the bacteria concentration, C, in the lake over time using the following iterative equation (13) The exact Euler's method is a numerical method, and therefore we need to check its accuracy. analytical solution for this problem can be found to be: (14) where, Co is the initial concentration in the lake. Using this equation, calculate Cexact (this is a function of "t', do not fetch ) .Create an overlay plot of your solutions: The first (numerical selution) should consist of a dashed black line (-) with circle markers, and the second (exact solution) should consist of a solid red line (-) with asterisk markers. Annotate the plot, use gridlines, and create a legend to discern the Euler and analytical solutions The function should provide following outputs: First week the lake is at a safe concentration (Make sure your answer is the first week, and not just the corresponding week's index) Hint: Use indexing and fetching, find the first week the lake is at a safe concentration o The second output (02) should be sach that it gives the value of I if the lake is safe by input goal weck or else the output (02)-0 Name the function as: Team# 88 PS
Step by Step Solution
There are 3 Steps involved in it

Get step-by-step solutions from verified subject matter experts