

Question: can i have help with this question I need B. i also sent the chart in case you need it thank you for your help
can i have help 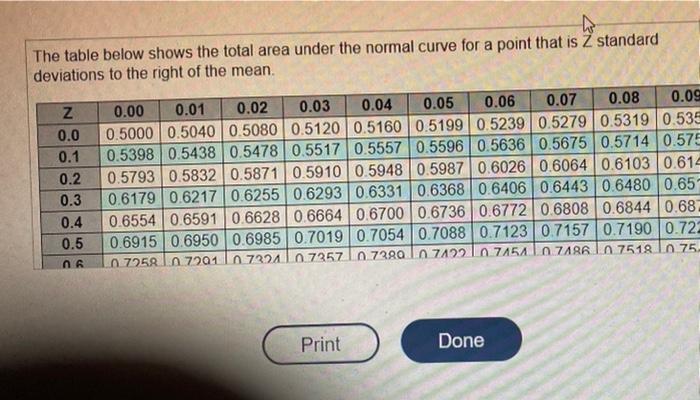
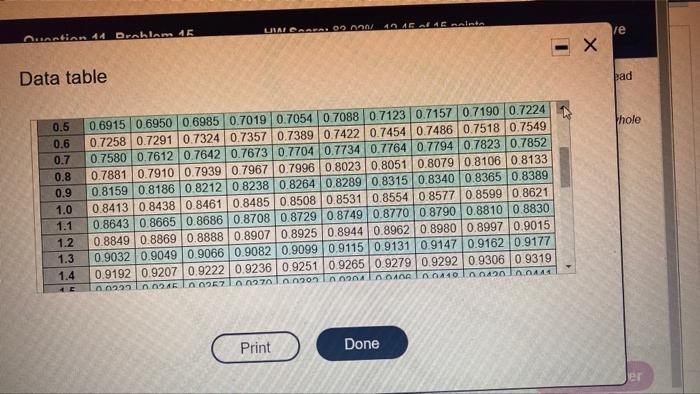
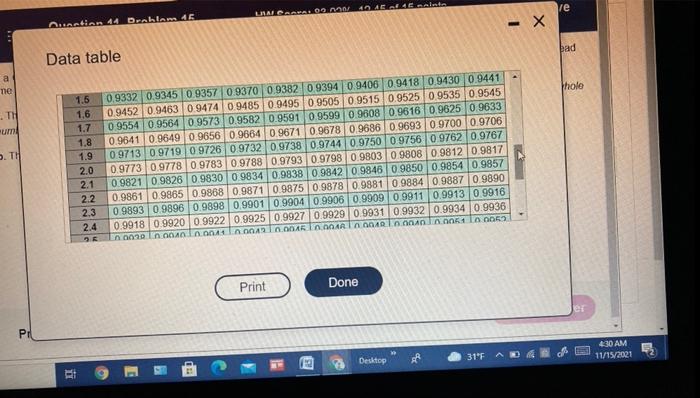
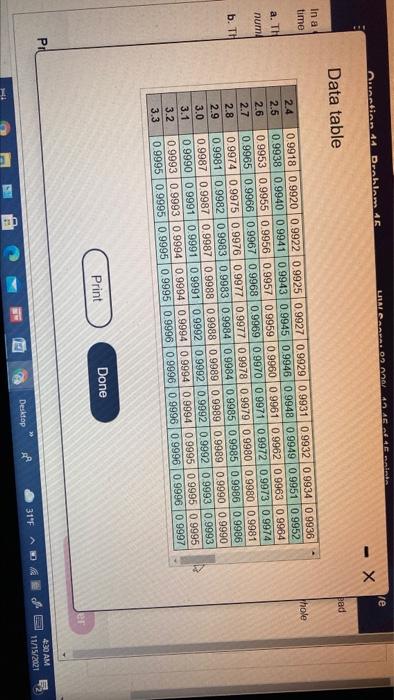
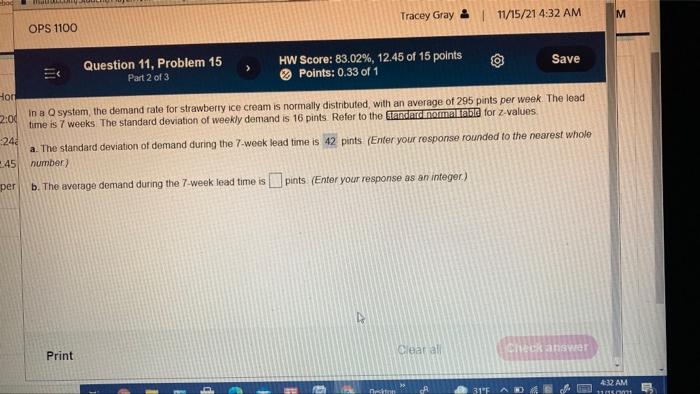
w The table below shows the total area under the normal curve for a point that is Z standard deviations to the right of the mean. z 0.0 0.1 0.2 0.3 0.4 0.5 0.00 0.01 0.02 0.03 0.04 0.05 0.06 0.07 0.08 0.09 0.5000 0.5040 0.5080 0.5120 0.51600.5199 0.5239 0.5279 0.5319 0.535 0.5398 0.5438 0.5478 0.5517 0.5557 0.5596 0.5636 0.5675 0.5714 0.575 0.5793 0.5832 0.58710.59100.5948 0.5987 0.6026 0.6064 0.6103 0.61 0.6179 0.62170.6255 0.6293 0.6331 0.6368 0.6406 0.6443 0.6480 0.65- 0.6554 0.6591 0.6628 0.66640.6700 0.6736 0.6772 0.6808 0.6844 0.687 0.6915 0.6950 0.69850.7019 0.7054 0.7088 0.7123 0.7157 0.7190 0.72 7258 In 7201 n7224 n 7257 1728a I 7422 n.7454 n ZAR In 7518 n75 ng Print Done 40 AC AC Dante UIAL CARA OD AA/ /e santian 44 Draklar 46 X Data table pad Whole 0.5 0.6 0.7 0.8 0.9 1.0 1.1 1.2 1.3 1.4 NO JOOX 0.6915 0.6950 0.6985 0.7019 0.7054 0.7088 0.7123 0.7157 0.7190 0.7224 0.7258 0.7291 0.7324 0.7357 0.7389 0.7422 0.7454 0.7486 0.7518 0.7549 0.7580 0.7612 0.7642 0.76730.7704 0.7734 0.7764 0.77940.7823 0.7852 0.7881 0.79100.7939 0.7967 0.7996 0.8023 0.8051 0.8079 0.8106 0.8133 0.8159 0.8186 0.8212 0.8238 0.8264 0.8289 0.8315 0.8340 0.8365 0.8389 0.8413 0.8438 0.8461 0.8485 0.8508 0.8531 0.85540.8577 0.8599 0.8621 0.86430.8665 0.8686 0.8708 0.8729 0.87490.8770 0.8790 0.88100.8830 0.8849 0.8869 0.8888 0.8907 0.8925 0.8944 0.8962 0.89800.8997 0.9015 0.9032 0.9049 0.9066 0.9082 0.9099 0.9115 0.9131 0.9147 0.9162 0.9177 0.91920.9207 0.9222 0.9236 0.9251 0.9265 0.9279 0.9292 0.9306 0.9319 0999 L 245 1002710027010090 n on A 410 1420 411 A Print Done Jer re LHA CAVALOS 46 AC Costa Nunction 44 Drablars 46 - X bad Data table 4 a ne thole TH um 1.5 1.6 1.7 1.8 TH 1.9 2.0 2.1 2.2 2.3 2.4 96 0.9332 0.0345 0.9357 0.93700.93820 9394 0.9406 0.941810.9430 0.9441 0.94520.9463 0.9474 0.9485 0.9495 0 9505 0.9515 0.9525 0.9535 0.9545 0.95540 95640 9573 0.9582 0.9591 0.9599 0.9608 0.9616 0.9625 0.9633 0.96410.9649 0.9656 09664 0.9671 0.9678 0.9686 0.9693 0.9700 0.9706 0 9713 0.97190 9726 0.9732 0.9738 0.9744 0.9750 09756 0.9762 0.9767 0.97730.9778 0 9783 0.9788 0.9793 0.9798 0.9803 0 9808 0.98120.9817 0.9821 0.9826 0.9830 0.9834 0.9838 0.9842 0.9846 0.9850 0.9854 0.9857 0.9861 0.98650.9868 0.9871 0.9875 0.9878 0.9881 0.9884 0.9887 0.9890 0.9893 0.9896 0.9898 0.9901 0.99040.9906 0.9909 0.9911 0.99130 9916 0.9918 0.9920 0.9922 0.9925 0.9927 0.9929 0.9931 0.9932 0.9934 0.9936 0020 IN ODININ DA210 OD NARIO000.000 in 005 A 006 Print Done ei P: 430 AM 11/19/2021 Desktop 31" FA 11 LRALCA. ODAG 40 4. Ensino Te continn 44 Droblem 45 - X pad Data table In a time Thole 4, TH num ININ OOCO No in b. TH 2.4 2.5 2.6 2.7 2.8 2.9 3.0 3.1 3.2 3.3 0.9918 0.9920 0.9922 0.9925 0.9927 0.9929 0.9931 0.9932 0.99340.9936 0.9938 0.9940 0.9941 0.9943 0.9945 0.9946 0.9948 0 9949 0 9951 0.9952 0.9953 0.9955 0.9956 0.9957 0 99590 9960 0.9961 0.9962 0.9963 0.9964 0.9965 0.9966 0.9967 0.9968 0.9969 0.99700 9971 0.9972 0.9973 0.9974 0.99740.9975 0.9976 0.9977 0.9977 0.9978 0.9979 0.99800.99800.9981 0.99810.9982 0.9983 0.99830.99840.9984 0.9985 0.9985 0.9986 0.9986 0.9987 0.99870.9987 0.9988 0.9988 0.9989 0.9989 0.9989 0.9990 0.9990 0.99900 9991 0.9991 0.9991 0.9992 0.9992 0.9992 0.9992 0.9993 0.9993 0.9993 0.9993 0.9994 0.99940.9994 0.9994 0.99940.9995 0.9995 0.9995 0.9995 0.9995 0.9995 0.9995 0.9996 0.9996 | 0.9996 0.9996 0.9996 0.9997 Print Done er Pil 4:30 AM 11/15/2021 31F A AND Desktop Tracey Gray & 11/15/214:32 AM M OPS 1100 Save Question 11. Problem 15 Part 2 of 3 HW Score: 83.02%, 12.45 of 15 points Points: 0.33 of 1 Hor 2:00 244 in a system the demand rate for strawberry ice cream is normally distributed, with an average of 295 pints per week The lead time is 7 weeks. The standard deviation of weekly demand is 16 pints Refer to the Standard normallable for z-values a. The standard deviation of demand during the 7-week lead time is 42 pints (Enter your response rounded to the nearest whole number) b. The average demand during the 7-week lead time is pints (Enter your response as an integer) -45 per Gleat al Check ansuret Print 4:32 AM Dec CA 31F
with this question I need B.
i also sent the chart in case you need it thank you for your help
Step by Step Solution
There are 3 Steps involved in it
1 Expert Approved Answer
Step: 1 Unlock

Question Has Been Solved by an Expert!
Get step-by-step solutions from verified subject matter experts
Step: 2 Unlock
Step: 3 Unlock