

Question: Can i please get some help with this questions Use correct units where appropriate (inches, years, etc) for percentiles. The horizontal axis of each graph
Can i please get some help with this questions
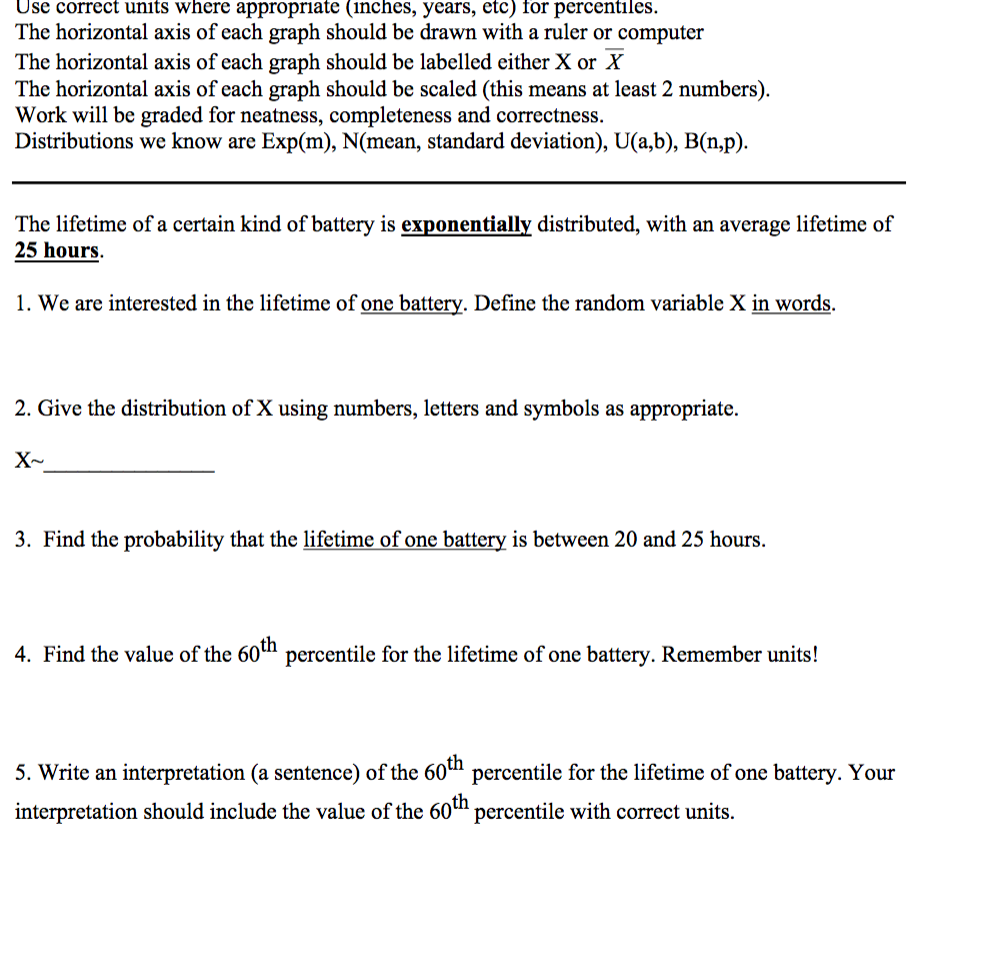
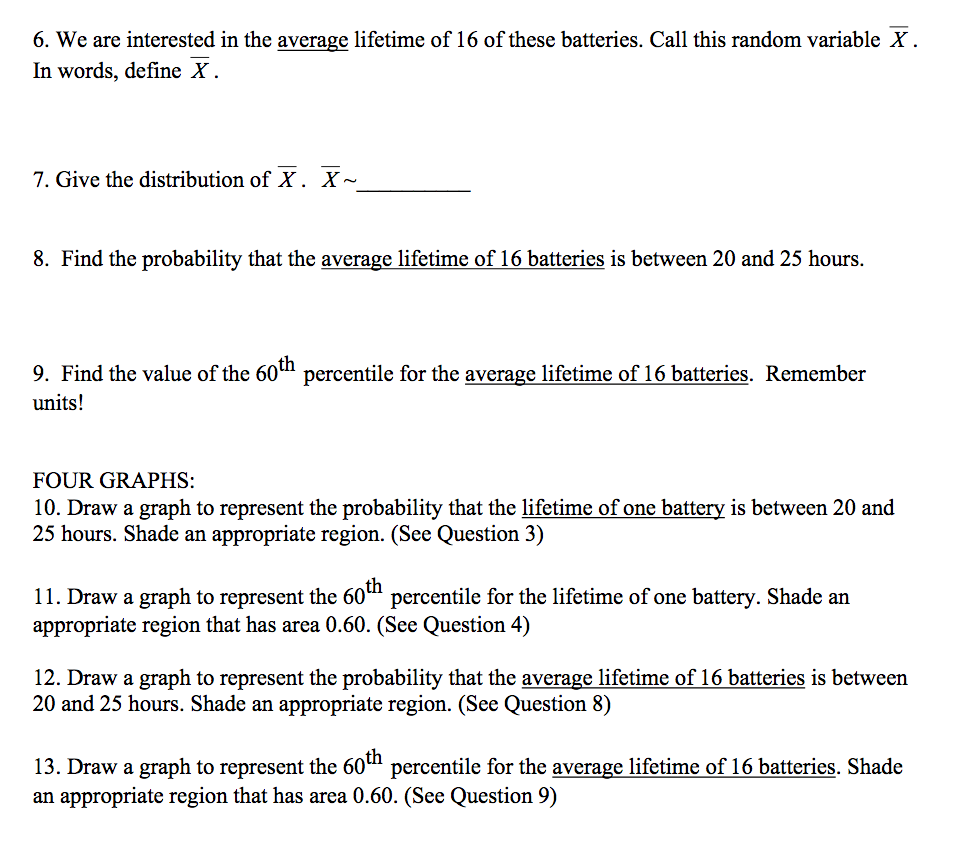
Use correct units where appropriate (inches, years, etc) for percentiles. The horizontal axis of each graph should be drawn with a ruler or computer The horizontal axis of each graph should be labelled either X or X The horizontal axis of each graph should be scaled (this means at least 2 numbers). Work will be graded for neatness, completeness and correctness. Distributions we know are Exp(m), N(mean, standard deviation), U(a,b), B(n,p). The lifetime of a certain kind of battery is exponentially distributed, with an average lifetime of 25 hours. 1. We are interested in the lifetime of one battery. Define the random variable X in words. 2. Give the distribution of X using numbers, letters and symbols as appropriate. X~ 3. Find the probability that the lifetime of one battery is between 20 and 25 hours. 4. Find the value of the 60' percentile for the lifetime of one battery. Remember units! 5. Write an interpretation (a sentence) of the 60 percentile for the lifetime of one battery. Your interpretation should include the value of the 60 percentile with correct units.6. We are interested in the average lifetime of 16 of these batteries. Call this random variable y . In words, dene E. 7. Give the distribution of f. f ~ 8. Find the probability that the average lifetime of 16 batteries is between 20 and 25 hours. 9. Find the value of the 60l'h percentile for the average lifetime of 16 batteries. Remember units! FOUR GRAPHS: 10. Draw a graph to represent the probability that the lifetime of one battery is between 20 and 25 hours. Shade an appropriate region. (See Question 3) 11. Draw a graph to represent the 601th percentile for the lifetime of one battery. Shade an appropriate region that has area 0.60. (See Question 4) 12. Draw a graph to represent the probability that the average lifetime of 16 batteries is between 20 and 25 hours. Shade an appropriate region. (See Question 8) 13. Draw a graph to represent the 60'd1 percentile for the average lifetime of 16 batteries. Shade an appropriate region that has area 0.60. (See Question 9)
Step by Step Solution
There are 3 Steps involved in it

Get step-by-step solutions from verified subject matter experts