

Question: Can I please have help with this. Nothing more is needed, everything needed is in the question. The following table shows the average monthly distance
Can I please have help with this. Nothing more is needed, everything needed is in the question.
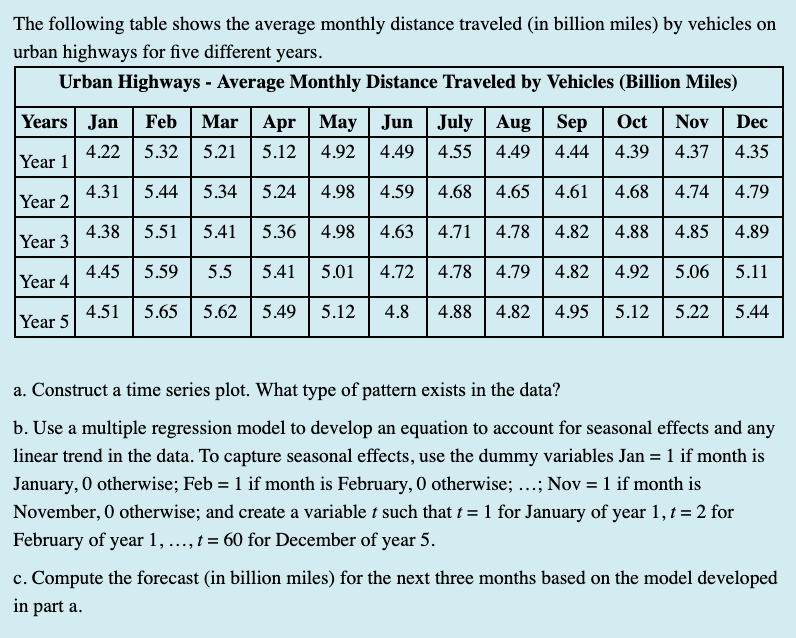
The following table shows the average monthly distance traveled (in billion miles) by vehicles on urban highways for five different years. Urban Highways - Average Monthly Distance Traveled by Vehicles (Billion Miles) Years Jan Feb Mar Apr May Jun July Aug Sep Oct Nov Dec Year 1 4.22 5.32 5.21 5.12 4.92 4.49 4.55 4.49 4.44 4.39 4.37 4.35 Year 2 4.31 5.44 5.34 5.24 4.98 4.59 4.68 4.65 4.61 4.68 4.74 4.79 Year 3 4.38 5.51 5.41 5.36 4.98 4.63 4.71 4.78 4.82 4.88 4.85 4.89 Year 4 4.45 5.59 5.5 5.41 5.01 4.72 4.78 4.79 4.82 4.92 5.06 5.11 Year 5 4.51 5.65 5.62 5.49 5.12 4.8 4.88 4.82 4.95 5.12 5.22 5.44 a. Construct a time series plot. What type of pattern exists in the data? b. Use a multiple regression model to develop an equation to account for seasonal effects and any linear trend in the data. To capture seasonal effects, use the dummy variables Jan = 1 if month is January, 0 otherwise; Feb = 1 if month is February, 0 otherwise; ...; Nov = 1 if month is November, 0 otherwise; and create a variable f such that t = 1 for January of year 1, t = 2 for February of year 1, ..., t= 60 for December of year 5. c. Compute the forecast (in billion miles) for the next three months based on the model developed in part a
Step by Step Solution
There are 3 Steps involved in it

Get step-by-step solutions from verified subject matter experts