

Question: Can I please help interpreting the statistics I calculated. I want to understand how they connect to my hypothesis. My null hypothesis in words is:
Can I please help interpreting the statistics I calculated. I want to understand how they connect to my hypothesis.
My null hypothesis in words is:
There is no difference in the portion of people wearing a mask exiting the store in the morning compared to the evening.
The alternative hypothesis in words:
The proportion of people wearing a mask exiting the store in the morning is greater than the proportion of people wearing a mask in the evening.
Please include explanations for:
P value
Standard error
Confidence interval
Standard deviations
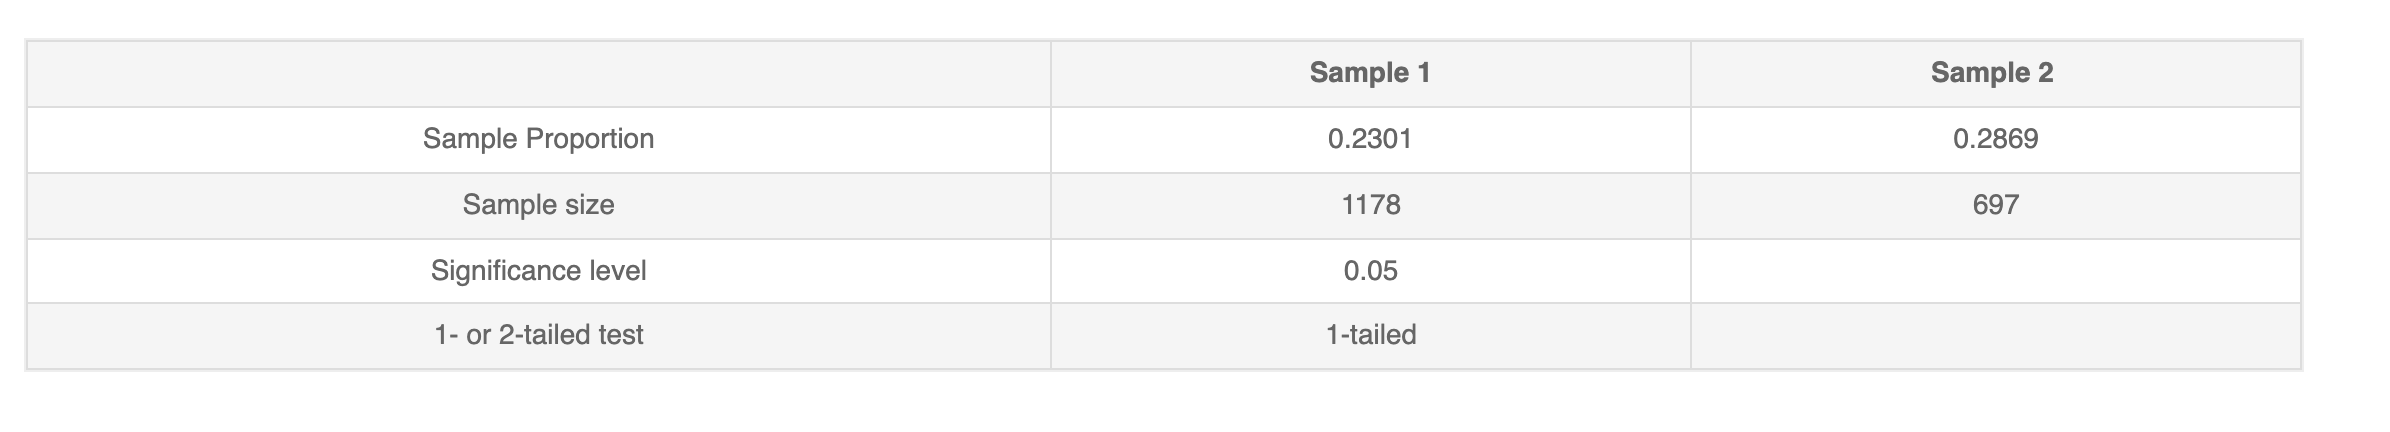
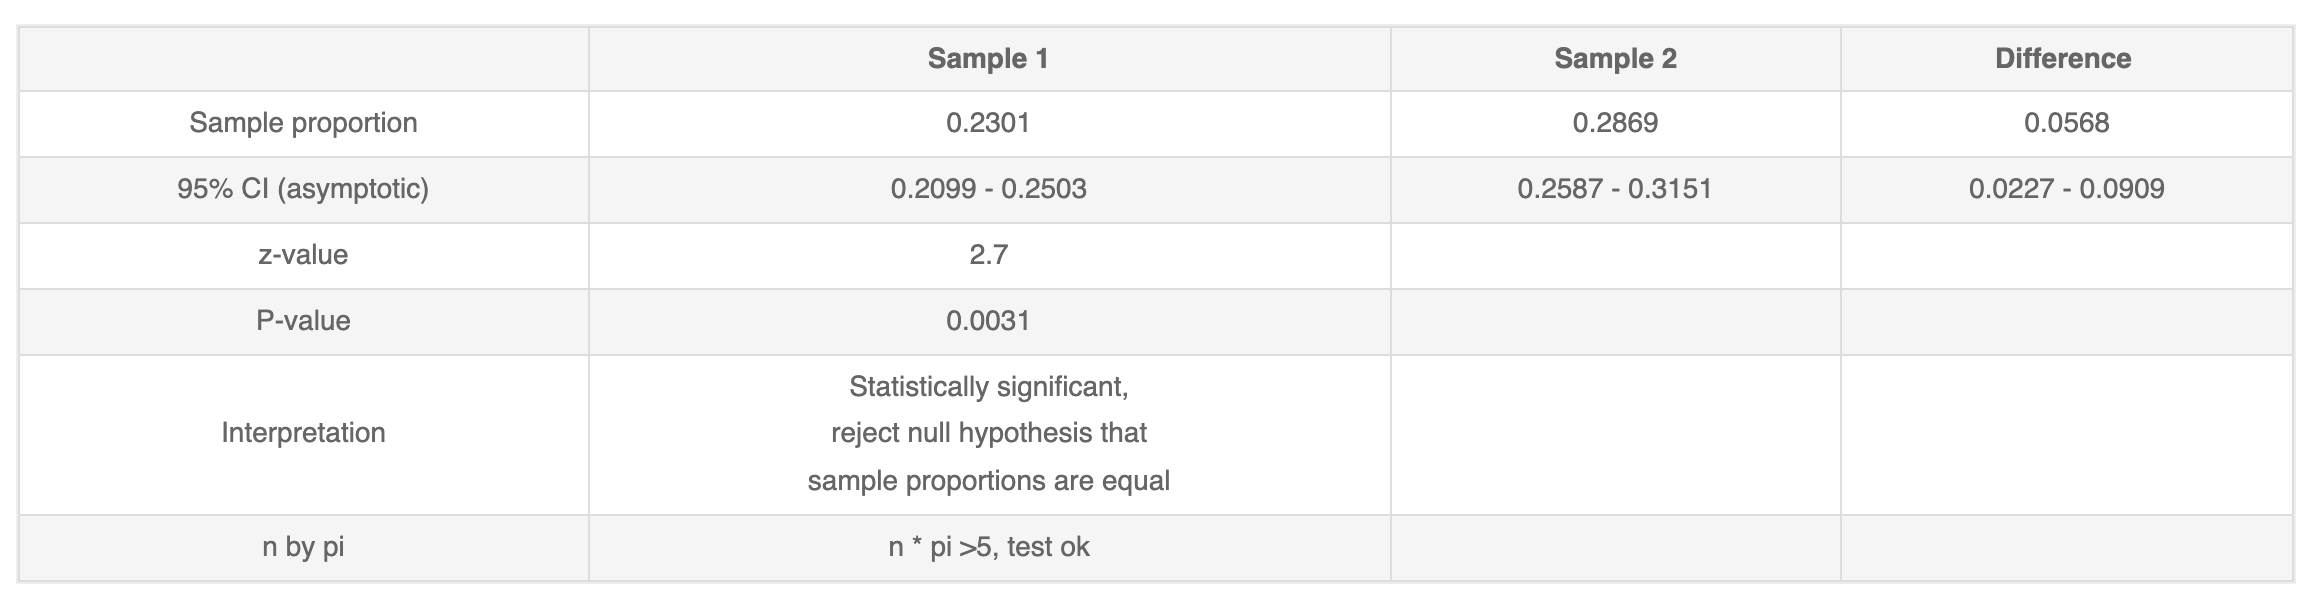
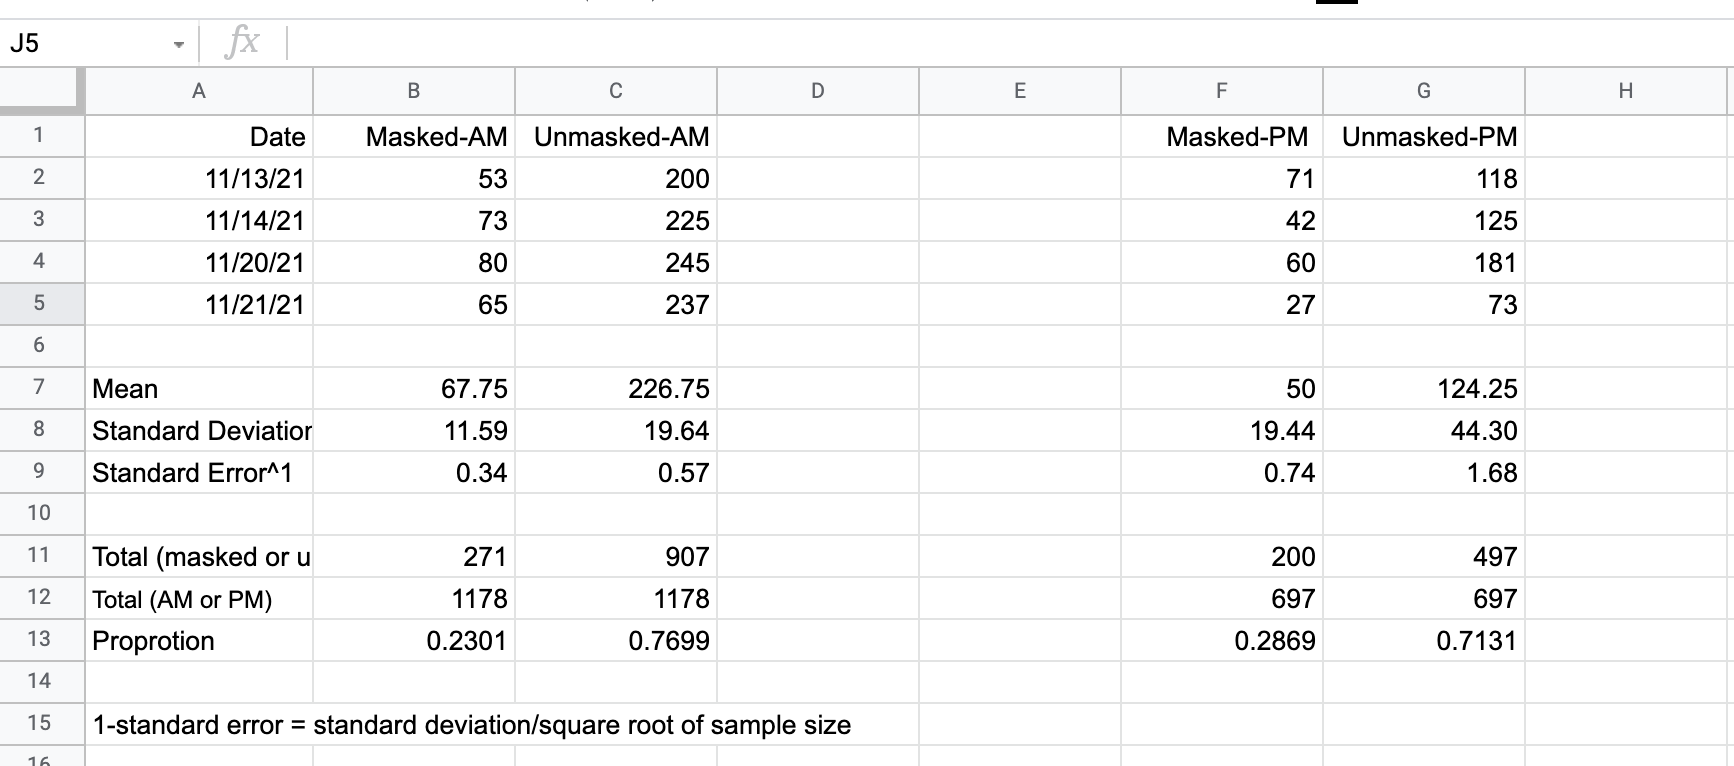
Sample 1 Sample 2 Sample Proportion 0.2301 0.2869 Sample size 1178 697 Significance level 0.05 1- or 2-taed test Hailed Sample 1 Sample 2 Difference Sample proportion 0.2301 0.2869 0.0568 95% CI (asymptotic) 0.2099 - 0.2503 0.2587 - 0.3151 0.0227 - 0.0909 z-value 2.7 P-value 0.0031 Statistically significant, Interpretation reject null hypothesis that sample proportions are equal n by pi n * pi >5, test okJ5 fx A B C D E F G H Date Masked-AM Unmasked-AM Masked-PM Unmasked-PM N 11/13/21 53 200 71 118 3 11/14/21 73 225 42 125 4 11/20/21 80 245 60 181 11/21/21 65 237 27 73 6 7 Mean 67.75 226.75 50 124.25 8 Standard Deviation 11.59 19.64 19.44 44.30 9 Standard Error^1 0.34 0.57 0.74 1.68 10 11 Total (masked or u 271 907 200 497 12 Total (AM or PM) 1178 1178 697 697 13 Proprotion 0.2301 0.7699 0.2869 0.7131 14 15 1-standard error = standard deviation/square root of sample size
Step by Step Solution
There are 3 Steps involved in it

Get step-by-step solutions from verified subject matter experts