

Question: Can I recieve help with this? I previously submitted this question and it was wrong. 8. Aspen Plastics produces plastic bottles for customer orders. The
Can I recieve help with this? I previously submitted this question and it was wrong.
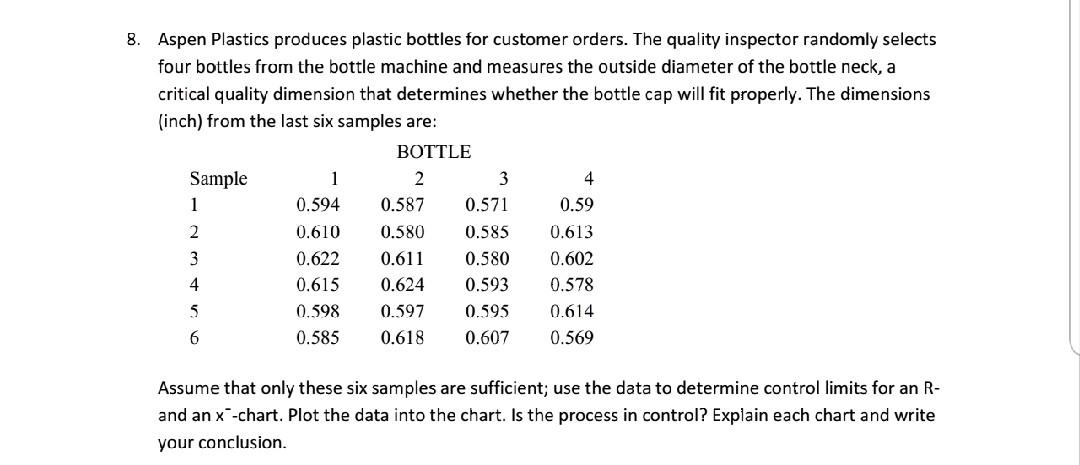
8. Aspen Plastics produces plastic bottles for customer orders. The quality inspector randomly selects four bottles from the bottle machine and measures the outside diameter of the bottle neck, a critical quality dimension that determines whether the bottle cap will fit properly. The dimensions (inch) from the last six samples are: BOTTLE Sample 1 2 3 1 0.594 0.587 0.571 0.59 2 0.610 0.580 0.585 0.613 3 0.622 0.611 0.580 0.602 4 0.615 0.624 0.593 0.578 5 0.598 0.597 0.595 0.614 6 0.585 0.618 0.607 0.569 Assume that only these six samples are sufficient; use the data to determine control limits for an R- and an x-chart. Plot the data into the chart. Is the process in control? Explain each chart and write your conclusionStep by Step Solution
There are 3 Steps involved in it
1 Expert Approved Answer
Step: 1 Unlock

Question Has Been Solved by an Expert!
Get step-by-step solutions from verified subject matter experts
Step: 2 Unlock
Step: 3 Unlock