

Question: Can some one check my work please BESU- Excel Project-SUM20 Page Layout Formulas Data Review View Tell me Share Comments Insert v = = .
Can some one check my work please
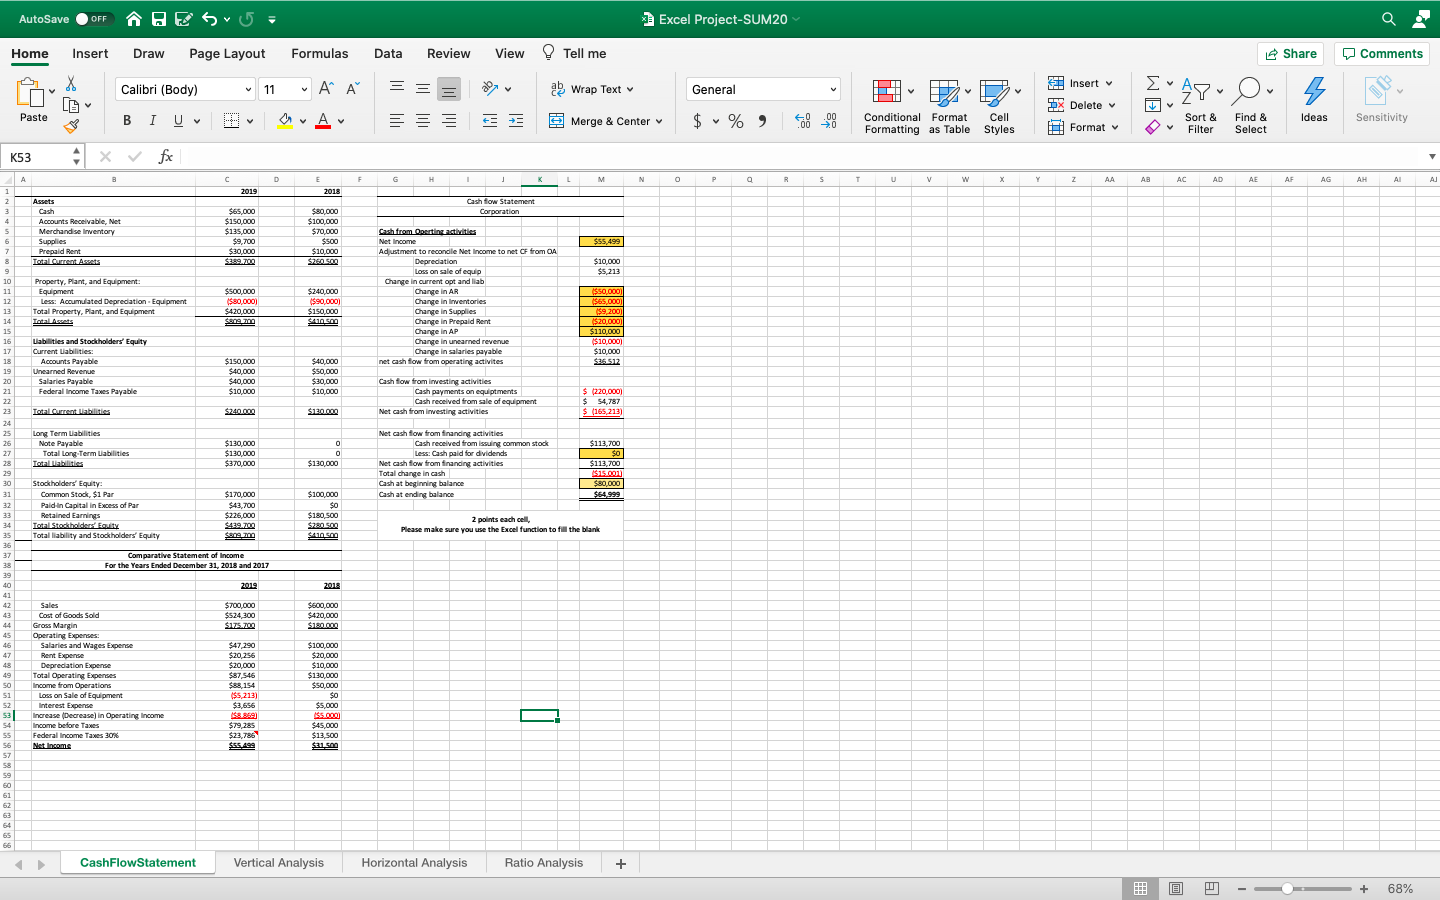
BESU- Excel Project-SUM20 Page Layout Formulas Data Review View Tell me Share Comments Insert v = = . AF ab Wrap Text General V Do WE AY O , DX Delete v A EE Merge & Center $ % ) .00 00 0 Ideas Conditional Format Formatting as Table Cell Styles Sensitivity Sort & Filter Format Find & Select fx E F G H 1 M N P a R S T U v w X z AA AB AC AD AE AF AG AJ 2018 Cash flow Statement Corporation $80,000 $100,000 $70,000 $500 $10,000 Sen $55,499 $10,000 $5,213 $240,000 ($90,000 $150,000 SA100 Cash from Boerting activities Net Income Adjustment to reconcile Net Income to net Of from OA Depreciation Loss on sale of equip Change in current opt and liab Change in AR Change in Inventories Change in Supplies Change in Prepaid Rent Change in AP Change in unearned revenue Change in salaries payable net cash flow from operating activites $50,000) $65.000] $9, 200] $20,000) $110.000 ($10,0001 $10,000 $25 $12 em com o SANA ANAMARINA SHARNAR HARSA $40,000 $50,00 $30,000 $10,000 Ourrent uab AutoSave OFF Home Insert Draw X v Calibri (Body) 11 Paste B I U K53 x . B C D 1 2019 2 Assets 3 Cash $65.000 4 Accounts Receivable, Net $150,000 5 Merchandise Inventory $135,000 6 Supplies $9,700 7 Prepaid Rent $30,000 8 $2.8979 9 10 Property, Plant, and Equipment: 11 Equipment $500,000 12 Less: Accumulated Depreciation Equipment $80,000) 13 Total Property, Plant, and Equipment $420,000 14 Total Assets SODE 700 15 16 Liabilities and Stockholders' Equity 17 18 Accounts Payable $150,000 19 Unearned Revenue $40,000 20 Salaries Payable $40,000 21 Federal Income Taxes Payable $10,000 22 23 Total Qurrent Liabilities $240.000 24 25 Long Term Liabilities 26 Note Payable $130,000 27 Total Long-Term Liabilities $130,000 28 Totalities $370,000 29 30 Stockholders' Equity 31 Common Stock, $1 Par $170,000 32 Paldin Capital in Excess of Par $43,700 33 Retained Earnings $226,000 34 Total Stockholders foulty $439.709 35 Total liability and Stockholders' Equity $800 700 36 37 Comparative Statement of Income 38 For the Years Ended December 31, 2018 and 2017 39 40 2019 41 42 Sales $700.000 43 Cost of Goods Sold $524 300 Gross Margin $175.70 45 Operating Expenses: 46 Salaries and Wages Expense $47,290 Rent Expense $20,256 45 Depreciation Expense $20,000 49 Total Operating Expenses $87.546 SO Income from Operations $88, 154 51 Loss on Sale of Equipment $5,213) 52 Interest Expense $3,656 53 Increase (Decrease) in Operating income S889) 541 Income before Taxes $79,285 SS Federal Income Taxes 30% $23,786 56 Net Income $55.499 57 58 59 60 61 62 Cash flow from investing activities Cash payments on equipments Cash received from sale of equipment Net cash from investing activities $ 220,000) $ 54,787 $ (165,213) $120.000 0 0 $130,000 Net cash flow from financing activities Cash received from issuing common stock Less: Cash paid for dividends Net cash flow from financing activities Total change in cash Cash at beginning balance Cash at ending balance $113,700 $0 $113,700 $15.001) $80,000 $54999 $100,000 $0 $180,500 $2805 $410 500 2 points each cell Please make sure you use the Excel function to fill the blank 2018 $600,000 $420,000 $180.000 $100,000 $20,000 $10,000 $130,000 $50,000 $0 $5,000 55.000 $45,000 $13,500 $21.500 3 64 65 66 CashFlowStatement Vertical Analysis Horizontal Analysis Ratio Analysis + A + 68%
Step by Step Solution
There are 3 Steps involved in it

Get step-by-step solutions from verified subject matter experts