

Question: Can somebody please explain it to me why these two charts are different? Damen Cilent MSFT-PG Portfolio O 0.0100 0.0090 0.0080 0.0070 0.0060 0.0050 0.0040
Can somebody please explain it to me why these two charts are different? 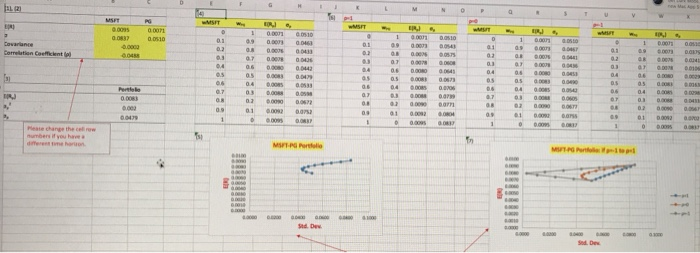
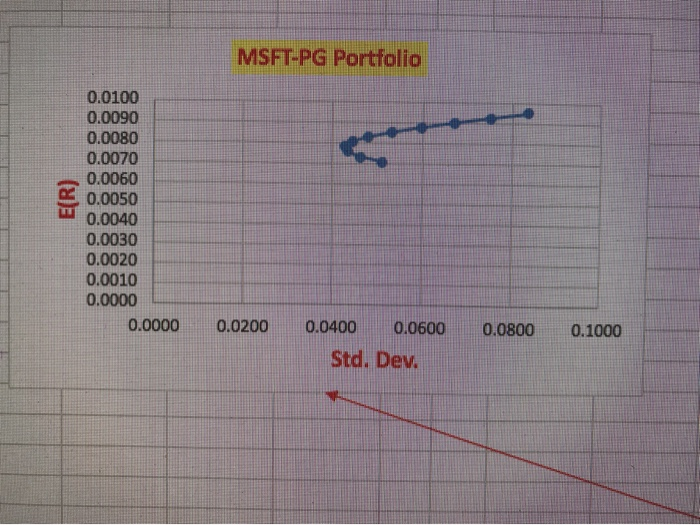
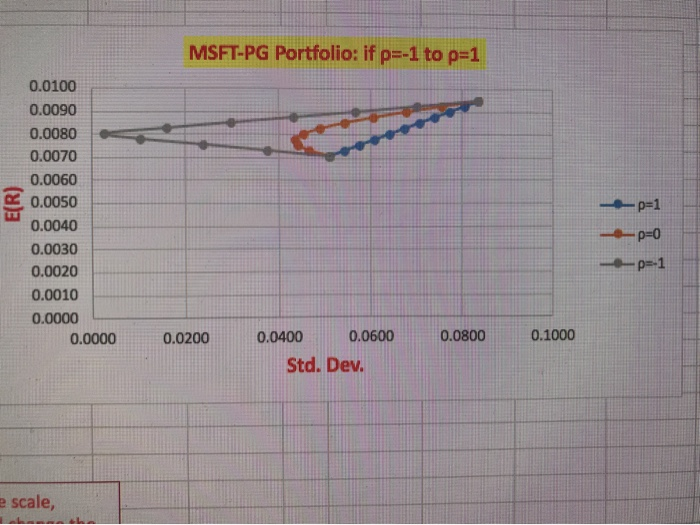
Damen Cilent MSFT-PG Portfolio O 0.0100 0.0090 0.0080 0.0070 0.0060 0.0050 0.0040 0.0030 0.0020 0.0010 0.0000 0.0000 0.0200 0.0800 0.1000 0.0400 0.0600 Std. Dev. MSFT-PG Portfolio: if p=-1 to p=1 0.0100 0.0090 0.0080 0.0070 0.0060 S 0.0050 0.0040 0.0030 0.0020 0.0010 0.0000 0.0000 -p=1 -po p=-1 0.0200 0.0800 0.1000 0.0400 0.0600 Std. Dev. escale
Step by Step Solution
There are 3 Steps involved in it
1 Expert Approved Answer
Step: 1 Unlock

Question Has Been Solved by an Expert!
Get step-by-step solutions from verified subject matter experts
Step: 2 Unlock
Step: 3 Unlock