

Question: Can somebody please interpret this? Probability Plot of Distance Normal - 95% CI 99 Mean 204.6 StDev 114.0 95 N 8 AD 0.608 90 P-Value
Can somebody please interpret this?

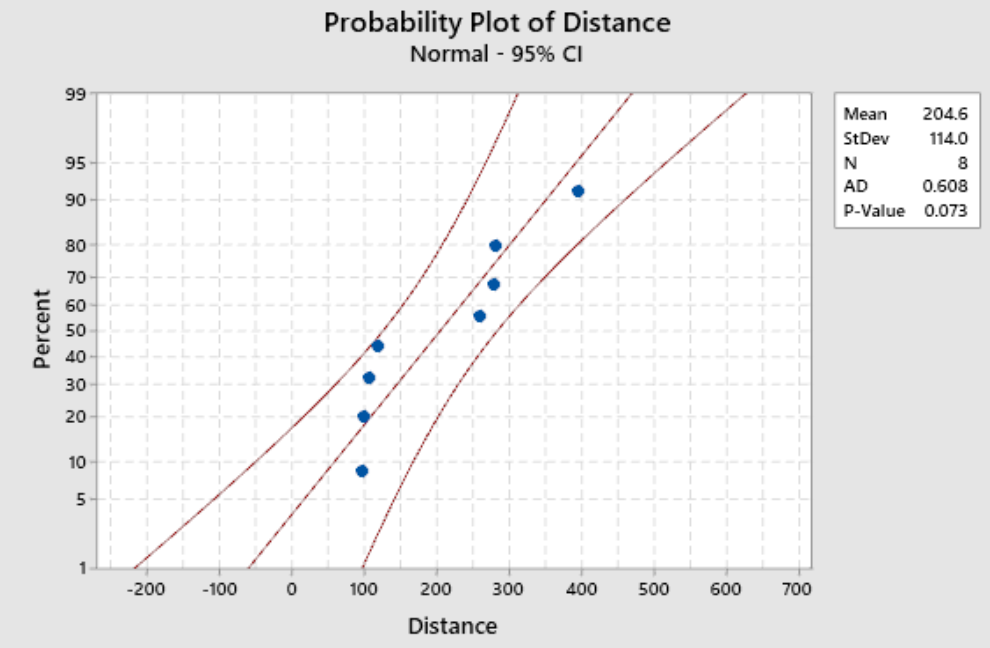
Probability Plot of Distance Normal - 95% CI 99 Mean 204.6 StDev 114.0 95 N 8 AD 0.608 90 P-Value 0.073 80 Percent 30 20 10 5 -200 -100 0 100 200 300 400 500 600 700 Distance
Step by Step Solution
There are 3 Steps involved in it
1 Expert Approved Answer
Step: 1 Unlock

Question Has Been Solved by an Expert!
Get step-by-step solutions from verified subject matter experts
Step: 2 Unlock
Step: 3 Unlock