

Question: Can someone answer and explain to me each step please? I Open the Al and Occupation Dataset and examine the data. For this assignment you
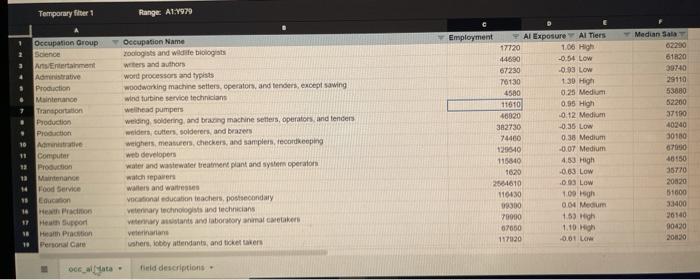
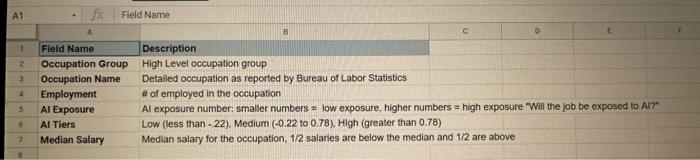
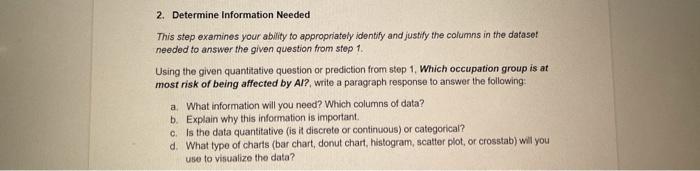
I Open the Al and Occupation Dataset and examine the data. For this assignment you will be answering the following question: Which occupation group is at most risk of being affected by AI? a. Explain why this question is important or significant. State the question and explain its significance or importance in your answer. b. List one additional quantitative question or prediction relating to the question above that could be investigated using this dataset. Explain how the additional question relates to the question above. Temporary filter Range: A1.1979 Occupation Group Science As Entertainment Administrative Production Maintenance Transportation Production Production Antrative 11 Computer 12 Production Maintenance Food Service 15 Cucation 18 Hest Praction Heat Support Health Praction Personal Care Occupation Name zoologists and Wildlife biologists writers and authors word processors and typists woodworking machine setters, operators, and tenders, except sawing wind turbine service technicians wellhead pumpers welding, soldering, and bring machine sees, operators, and tenders widers, cutters, solderers, and brazers wighes, meatures, checkers, and samplers, recordkeeping web developers water and wastewater treatment plant and system operator watch reparers water and was vocational education teachers, possecondary Veterinary technologists and technicians wystants and taboratory ma cetakers Employment Al Exposure Al Tiers 17720 106 High 44690 -0.54 Low 67230 0.33 Low 70130 30 High 4580 0.25 Medium 11610 0.95 High 40020 0.12 Medium 382730 -0.36 Low 74400 0.38 Medium 129540 -0.07 Medium 115840 453 High 1620 -0.00 Low 254610 0.03 Low 11640 1.00 h 300 0.04 Medium 79000 1.5) High 07000 117020 0.01 L Median Sala 62290 51820 39740 29110 53680 52200 37190 40240 30100 07050 40150 35770 20020 51600 33400 36140 00420 2000 1.10 ushers, lobby intendants, and ticket toners porta Held descriptions A1 1 2 Field Name A B Field Name Description Occupation Group High Level occupation group Occupation Name Detailed occupation as reported by Bureau of Labor Statistics Employment #of employed in the occupation Al Exposure Al exposure number: smaller numbers = low exposure, higher numbers high exposure "Will the job be exposed to Al?" Al Tiers Low (less than - 22), Medium (-0.22 to 0.78), High (greater than 0.78) Median Salary Median salary for the occupation, 1/2 salaries are below the median and 1/2 are above 4 5 7 2. Determine Information Needed This step examines your ability to appropriately identify and justify the columns in the dataset needed to answer the given question from step 1 Using the given quantitative question or prediction from step 1. Which occupation group is at most risk of being affected by Al?, write a paragraph response to answer the following: a What information will you need? Which columns of data? b. Explain why this information is important is the data quantitative (is it discrete or continuous) or categorical? d. What type of charts (bar chart, donut chart, histogram, scatter plot, or crosstab) will you use to visualize the data
Step by Step Solution
There are 3 Steps involved in it

Get step-by-step solutions from verified subject matter experts