

Question: Can someone do this matlab code for the 2 task Projectile Motion without air drag Position of the Projectile The parameters have the following meaning
 Can someone do this matlab code for the 2 task
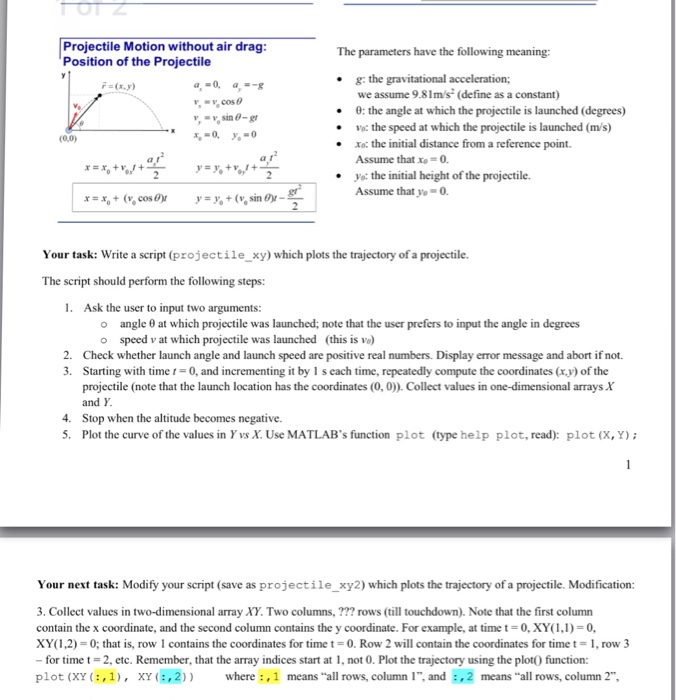
 Projectile Motion without air drag Position of the Projectile The parameters have the following meaning g: the gravitational acceleration; #2 (x,y) we assume 9.81m/s (define as a constant) 0: the angle at which the projectile is launched (degrees) Vo: the speed at which the projectile is launched (ms) y y.cos (0,0) .Xo: the initial distance from a reference point. Assume that xo = 0. yo: the initial height of the projectile. Assume that y-0 Your task: Write a script (projectile xy) which plots the trajectory of a projectile. The script should perform the following steps: Ask the user to input two arguments: angle at which projectile was launched; note that the user prefers to input the angle in degrees o speed v at which projectile was launched (this is ve o 2. Check whether launch angle and launch speed are positive real numbers. Display error message and abort if not. 3. Starting with time t-0, and incrementing it by I s each time, repeatedly compute the coordinates (xy) of the projectile (note that the launch location has the coordinates (0,0)). Collect values in one-dimensional arrays X and Y 4 Stop when the altitude becomes negative. 5. Plot the curve of the values in Yvs X. Use MATLAB's function plot (type help plot, read): plot (X, Y) Your next task: Modify your script (save as projectile_xy2) which plots the trajectory of a projectile. Modification: 3. Collect values in two-dimensional array XY. Two columns, ??? rows (till touchdown). Note that the first column contain the x coordinate, and the second column contains the y coordinate. For example, at time t = 0, XY( 1,1) = 0, XY( 1-2) = 0; that is, row I contains the coordinates for time t = 0. Row 2 will contain the coordinates for time t = 1, row 3 for time t-2, etc. Remember, that the array indices start at 1, not 0. Plot the trajectory using the plot0 function: plot (XY :,1), xY(:,2 where:,1 means "all rows, column 1, and :,2 means "all rows, column 2
Step by Step Solution
There are 3 Steps involved in it

Get step-by-step solutions from verified subject matter experts