

Question: can someone explain please, been stuck with this question. thanks in advance The table below shows the inventory-sales ratio for manufacturing and trade for a
can someone explain please, been stuck with this question. thanks in advance
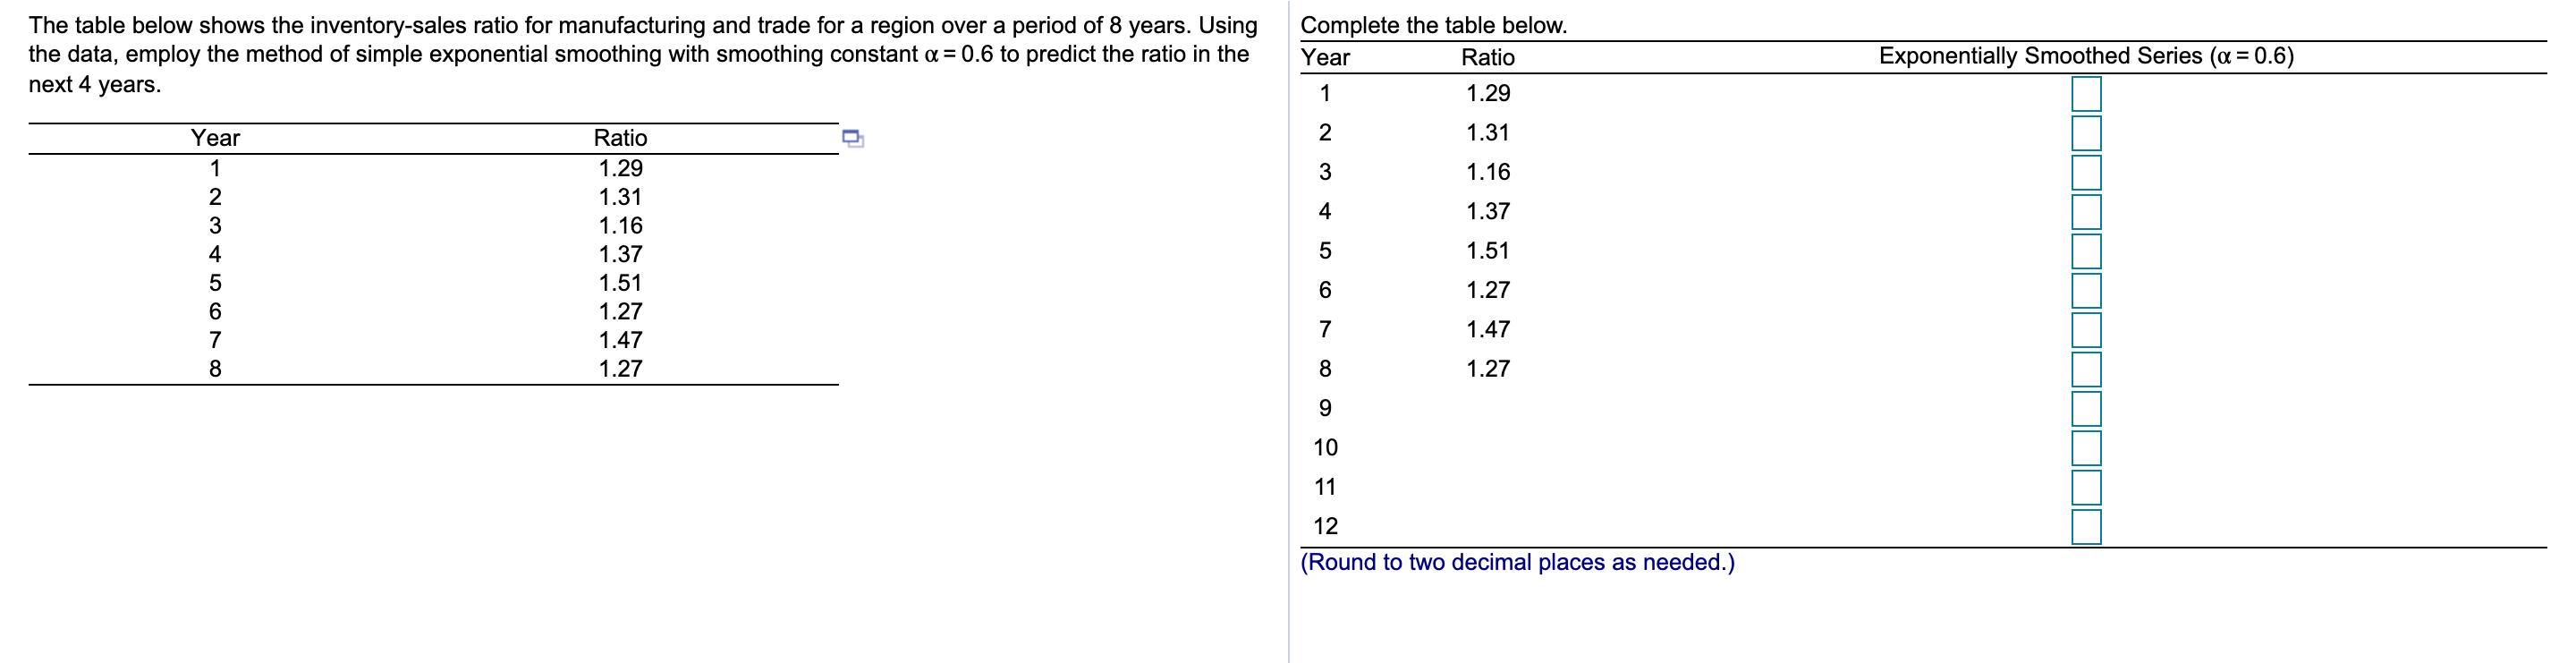
The table below shows the inventory-sales ratio for manufacturing and trade for a region over a period of 8 years. Using Complete the table below. the data, employ the method of simple exponential smoothing with smoothing constant u= 0.6 to predict the ratio in the Year Ratio Exponentially Smoothed Series (a = 0.6) next 4 years. 1 129 Year Ratio D 2 131 1 1 .29 3 1 .16 2 1.31 3 1.16 4 1'37 4 1.37 5 1.51 5 1-51 s 1.27 6 1.27 1 1.47 7 "47 8 1.27 8 1.27 9 10 1 1 1 2 (Round to two decimal places as needed.)
Step by Step Solution
There are 3 Steps involved in it
1 Expert Approved Answer
Step: 1 Unlock

Question Has Been Solved by an Expert!
Get step-by-step solutions from verified subject matter experts
Step: 2 Unlock
Step: 3 Unlock