

Question: Can someone explain what should I do in this page named bsg game? Thank you WORKFORCE COMPENSATION & TRAINING North America Facility Industry Company Average
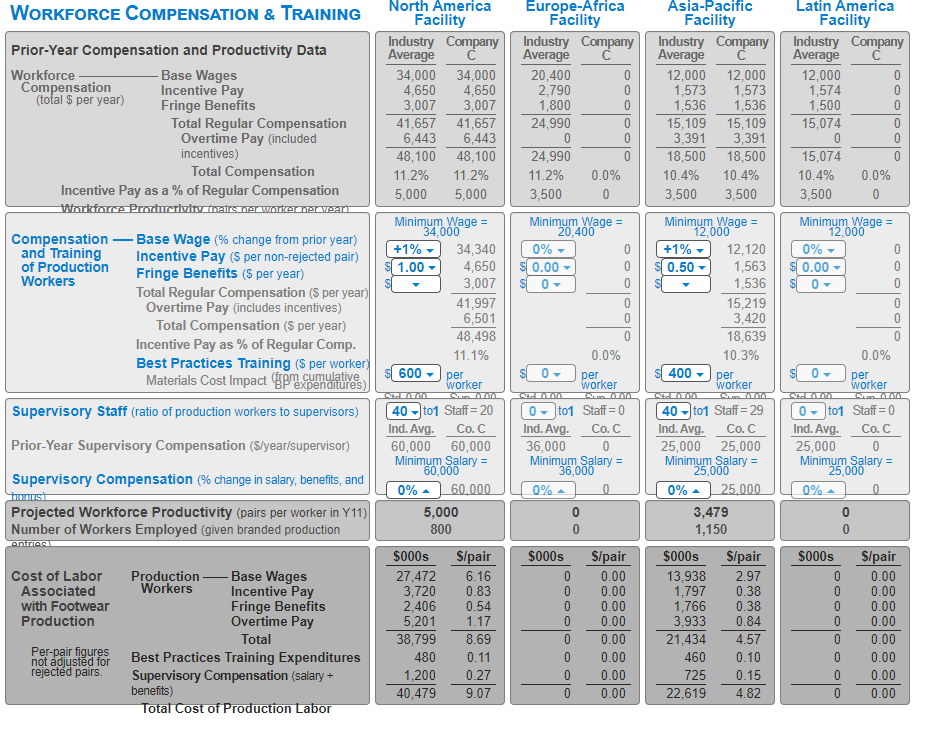
Can someone explain what should I do in this page named bsg game?
Thank you
WORKFORCE COMPENSATION & TRAINING North America Facility Industry Company Average 34,000 34,000 4,650 4,650 3,007 3,007 41,657 41,657 6,443 6,443 48, 100 48,100 11.2% 11.2% 5,000 5,000 Europe-Africa Facility Industry Company Average 20,400 0 2,790 0 1,800 0 24,990 0 0 0 24,990 11.2% 0.0% 3,500 0 Asia-Pacific Facility Industry Company Average 12,000 12,000 1,573 1,573 1,536 1,536 15,109 15,109 3,391 3,391 18,500 18,500 10.4% 10.4% 3,500 3,500 Latin America Facility Industry Company Average 12,000 0 1,574 0 1,500 15,074 0 0 0 15,074 10.4% 0.0% 3,500 0 OOOOOO Prior-Year Compensation and Productivity Data Workforce Base Wages Compensation Incentive Pay (total $ per year) Fringe Benefits Total Regular Compensation Overtime Pay (included incentives) Total Compensation Incentive Pay as a % of Regular Compensation Workforce Productivity that her workererwear Compensation - Base Wage (% change from prior year) and Training Incentive Pay (S per non-rejected pair) of Production Workers Fringe Benefits ($ per year) Total Regular Compensation (5 per year) Overtime Pay (includes incentives) Total Compensation (s per year) Incentive Pay as % of Regular Comp. Best Practices Training ($ per worker) Materials Cost Impact pr. cumulatives Supervisory Staff (ratio of production workers to supervisors) Minimum Wage = 20.400 0%- 0 0.00 - 0- 0 Minimum Wage = 12,000 0% - 0 0.00 - 0- 0 0.50 Minimum Wage = 34.000 +1% 34,340 1.00 4,650 3,007 41,997 6,501 48,498 11.1% 600 per worker Minimum Wage = 12.000 +1% 12,120 1,563 1,536 15,219 3,420 18,639 10.3% 400 - per worker OOOOOO 0 Oo 0 0.0% 0 0.0% per worker 0- 0- per worker Prior-Year Supervisory Compensation (Syear/supervisor) 40t01 Staff = 20 Ind. Avg. Co. C 60,000 60,000 Minimum Salary = 60,000 0% 60.000 5,000 800 0-101 Staff=0 Ind. Avg. Co. C 36,000 0 Minimum Salary = 36,000 0% 0 40t01 Staff = 29 Ind. Avg. Co. C 25,000 25,000 Minimum Salary = 25,000 0% 25.000 3,479 1,150 0 to1 Staff=0 Ind. Avg. Co.C 25,000 0 Minimum Salary = 25,000 0 Supervisory Compensation (% change in salary, benefits, and HOUSE Projected Workforce Productivity (pairs per worker in Y11) Number of Workers Employed (given branded production 0% Oo 0 Antra $000s $000s Cost of Labor Associated with Footwear Production Production Base Wages Workers Incentive Pay Fringe Benefits Overtime Pay Total Best Practices Training Expenditures Supervisory Compensation (salary + benefits) Total Cost of Production Labor $000s 27,472 3,720 2,406 5,201 38,799 480 1,200 40,479 S/pair 6.16 0.83 0.54 1.17 8.69 0.11 0.27 9.07 OOOOO OOO S/pair 0.00 0.00 0.00 0.00 0.00 0.00 0.00 0.00 $000s 13,938 1,797 1,766 3,933 21,434 460 725 22,619 S/pair 2.97 0.38 0.38 0.84 4.57 0.10 0.15 4.82 S/pair 0.00 0.00 0.00 0.00 0.00 0.00 0.00 0.00 Per-pair figures not adjusted for rejected pairs. WORKFORCE COMPENSATION & TRAINING North America Facility Industry Company Average 34,000 34,000 4,650 4,650 3,007 3,007 41,657 41,657 6,443 6,443 48, 100 48,100 11.2% 11.2% 5,000 5,000 Europe-Africa Facility Industry Company Average 20,400 0 2,790 0 1,800 0 24,990 0 0 0 24,990 11.2% 0.0% 3,500 0 Asia-Pacific Facility Industry Company Average 12,000 12,000 1,573 1,573 1,536 1,536 15,109 15,109 3,391 3,391 18,500 18,500 10.4% 10.4% 3,500 3,500 Latin America Facility Industry Company Average 12,000 0 1,574 0 1,500 15,074 0 0 0 15,074 10.4% 0.0% 3,500 0 OOOOOO Prior-Year Compensation and Productivity Data Workforce Base Wages Compensation Incentive Pay (total $ per year) Fringe Benefits Total Regular Compensation Overtime Pay (included incentives) Total Compensation Incentive Pay as a % of Regular Compensation Workforce Productivity that her workererwear Compensation - Base Wage (% change from prior year) and Training Incentive Pay (S per non-rejected pair) of Production Workers Fringe Benefits ($ per year) Total Regular Compensation (5 per year) Overtime Pay (includes incentives) Total Compensation (s per year) Incentive Pay as % of Regular Comp. Best Practices Training ($ per worker) Materials Cost Impact pr. cumulatives Supervisory Staff (ratio of production workers to supervisors) Minimum Wage = 20.400 0%- 0 0.00 - 0- 0 Minimum Wage = 12,000 0% - 0 0.00 - 0- 0 0.50 Minimum Wage = 34.000 +1% 34,340 1.00 4,650 3,007 41,997 6,501 48,498 11.1% 600 per worker Minimum Wage = 12.000 +1% 12,120 1,563 1,536 15,219 3,420 18,639 10.3% 400 - per worker OOOOOO 0 Oo 0 0.0% 0 0.0% per worker 0- 0- per worker Prior-Year Supervisory Compensation (Syear/supervisor) 40t01 Staff = 20 Ind. Avg. Co. C 60,000 60,000 Minimum Salary = 60,000 0% 60.000 5,000 800 0-101 Staff=0 Ind. Avg. Co. C 36,000 0 Minimum Salary = 36,000 0% 0 40t01 Staff = 29 Ind. Avg. Co. C 25,000 25,000 Minimum Salary = 25,000 0% 25.000 3,479 1,150 0 to1 Staff=0 Ind. Avg. Co.C 25,000 0 Minimum Salary = 25,000 0 Supervisory Compensation (% change in salary, benefits, and HOUSE Projected Workforce Productivity (pairs per worker in Y11) Number of Workers Employed (given branded production 0% Oo 0 Antra $000s $000s Cost of Labor Associated with Footwear Production Production Base Wages Workers Incentive Pay Fringe Benefits Overtime Pay Total Best Practices Training Expenditures Supervisory Compensation (salary + benefits) Total Cost of Production Labor $000s 27,472 3,720 2,406 5,201 38,799 480 1,200 40,479 S/pair 6.16 0.83 0.54 1.17 8.69 0.11 0.27 9.07 OOOOO OOO S/pair 0.00 0.00 0.00 0.00 0.00 0.00 0.00 0.00 $000s 13,938 1,797 1,766 3,933 21,434 460 725 22,619 S/pair 2.97 0.38 0.38 0.84 4.57 0.10 0.15 4.82 S/pair 0.00 0.00 0.00 0.00 0.00 0.00 0.00 0.00 Per-pair figures not adjusted for rejected pairsStep by Step Solution
There are 3 Steps involved in it
1 Expert Approved Answer
Step: 1 Unlock

Question Has Been Solved by an Expert!
Get step-by-step solutions from verified subject matter experts
Step: 2 Unlock
Step: 3 Unlock