

Question: Can someone explained with the follwoing guidline by using excel plz? Problem 9: 40 Points Graph the following linear inequalities on the digital graph paper
Can someone explained with the follwoing guidline by using excel plz?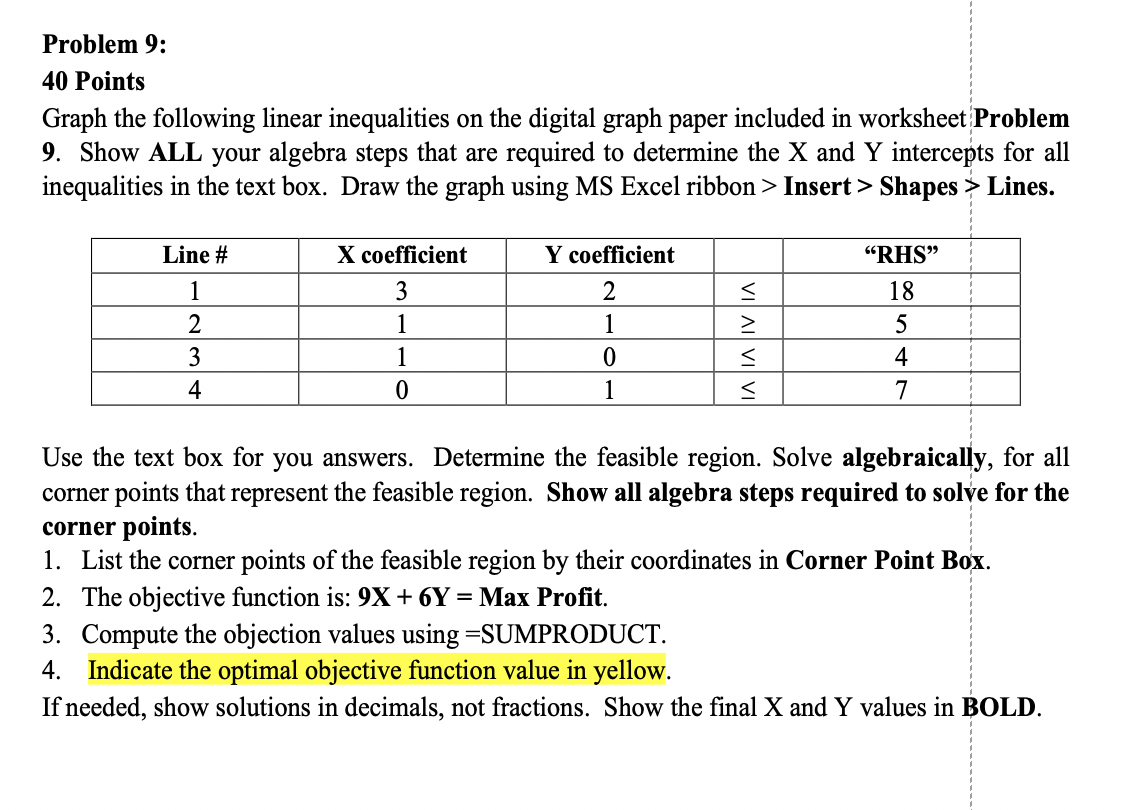
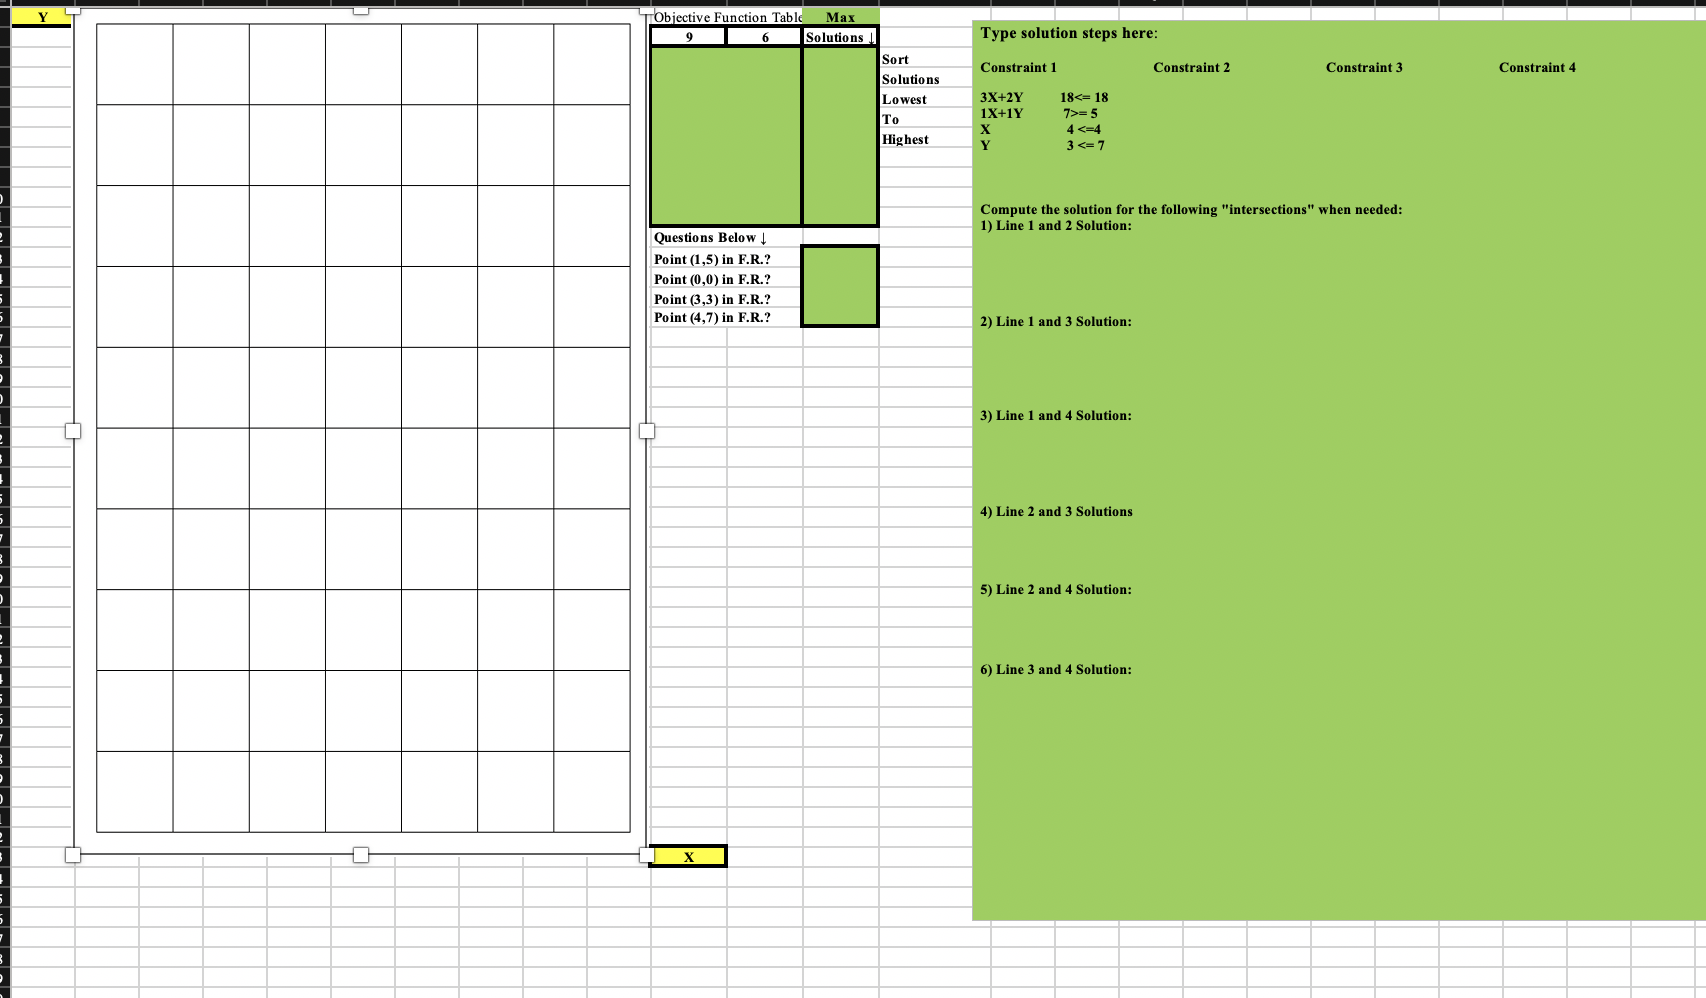
Problem 9: 40 Points Graph the following linear inequalities on the digital graph paper included in worksheet Problem 9. Show ALL your algebra steps that are required to determine the X and Y intercepts for all inequalities in the text box. Draw the graph using MS Excel ribbon > Insert > Shapes > Lines. Use the text box for you answers. Determine the feasible region. Solve algebraically, for all corner points that represent the feasible region. Show all algebra steps required to solve for the corner points. 1. List the corner points of the feasible region by their coordinates in Corner Point Box. 2. The objective function is: 9X+6Y= Max Profit. 3. Compute the objection values using = SUMPRODUCT. 4. Indicate the optimal objective function value in yellow. If needed, show solutions in decimals, not fractions. Show the final X and Y values in BOLD
Step by Step Solution
There are 3 Steps involved in it

Get step-by-step solutions from verified subject matter experts