

Question: Can Someone Help? Interpreting a Boxplot The boxplot displays a summary of 20 test scores 22 26 30 34 38 42 46 50 54 58
Can Someone Help?
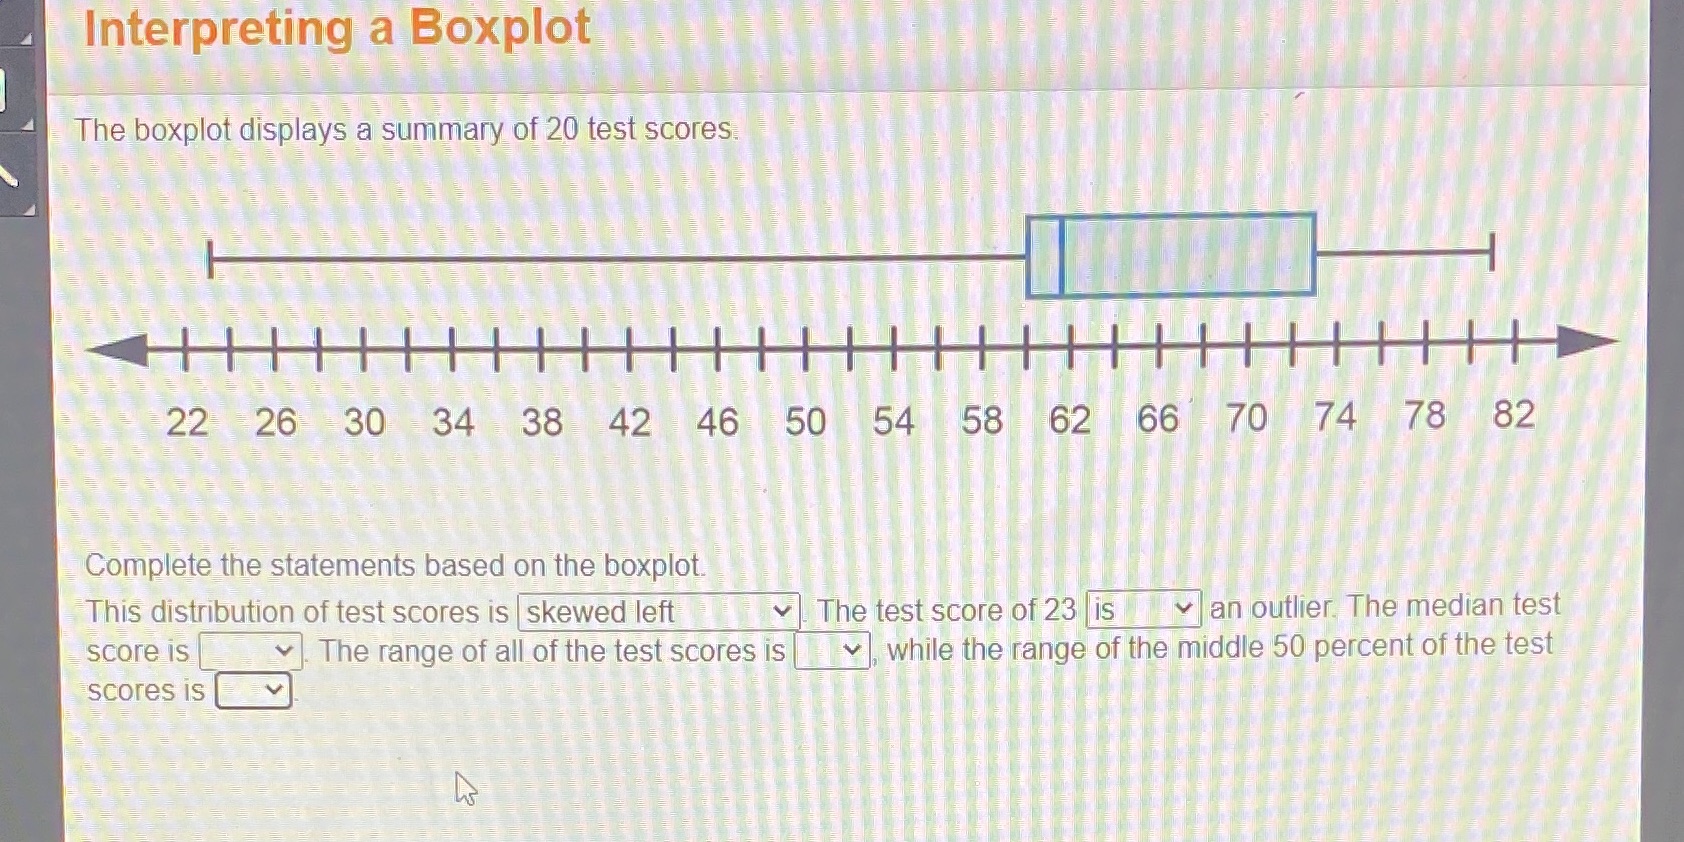
Interpreting a Boxplot The boxplot displays a summary of 20 test scores 22 26 30 34 38 42 46 50 54 58 62 66 70 74 78 82 Complete the statements based on the boxplot. This distribution of test scores is skewed left v The test score of 23 is Tian outlier. The median test score Is v The range of all of the test scores is , while the range of the middle 50 percent of the test scores Is
Step by Step Solution
There are 3 Steps involved in it
1 Expert Approved Answer
Step: 1 Unlock

Question Has Been Solved by an Expert!
Get step-by-step solutions from verified subject matter experts
Step: 2 Unlock
Step: 3 Unlock