

Question: can someone help me and do it on notebook paper 1 Yeah (2008 -501 1) This is a graph of the increase in Gross Domestic
can someone help me and do it on notebook paper
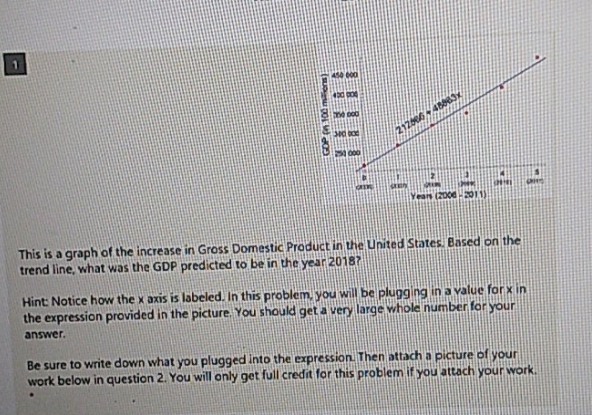
1 Yeah (2008 -501 1) This is a graph of the increase in Gross Domestic Product in the United States. Based on the trend line, what was the GDP predicted to be in the year 20187 Hint: Notice how the x axis is labeled. In this problem, you will be plugging in a value for x in the expression provided in the picture, You should get a very large whole number for your answer. Be sure to write down what you plugged into the expression. Then attach a picture of your work below in question 2. You will only get full credit for this problem if you attach your work
Step by Step Solution
There are 3 Steps involved in it
1 Expert Approved Answer
Step: 1 Unlock

Question Has Been Solved by an Expert!
Get step-by-step solutions from verified subject matter experts
Step: 2 Unlock
Step: 3 Unlock