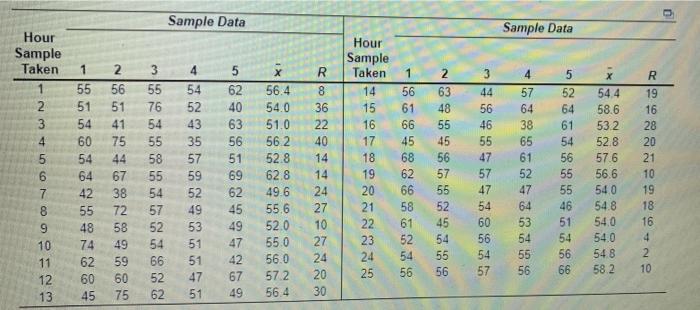
Question: can someone help me answer this? a) For the given data, the x = 55.120 hours (round your response to three decimal places) For the

can someone help me answer this? can someone help me answer this? a) For the given
can someone help me answer this? a) For the given
a) For the given data, the x = 55.120 hours (round your response to three decimal places) For the given data, mean range = 19.16 hours (round your response to two decimal places) With z=3. the control limits for the mean chart are UCL = 58 12 hours (round your response to three decimal places) LCL: = 52. 12 hours (round your response to three decimal places) The control limits for the range chart are: UCLA = 22 16 hours (round your response to two decimal places) LCL2 = 16 16 hours (round your response to two decimal places), n Sample Data Sample Data Hour Sample Taken Hour Sample Taken X 1 2 3 4 5 1 3 4 5 R 56 51 19 14 15 56 52 64 61 54.4 58.6 53.2 16 41 43 16 55 46 28 54 20 40 14 52.8 57.6 21 54 60 54 64 42 55 48 74 62 60 45 14 75 44 67 38 72 58 49 59 60 75 55 76 54 55 58 55 54 57 52 54 66 52 62 35 57 59 52 49 53 51 51 47 51 62 40 63 56 51 69 62 45 49 47 42 67 49 x 56.4 54.0 51.0 56 2 52.8 62.8 49.6 55.6 52.0 55.0 56.0 572 56.4 56 61 66 45 68 62 66 58 61 52 54 56 17 18 19 20 21 22 23 24 25 57 64 38 65 61 52 47 64 53 54 45 56 57 55 52 45 54 55 47 57 47 54 60 24 27 10 27 24 20 30 56 55 55 46 51 54 56 66 56.6 540 54.8 54,0 54.0 10 19 18 16 56 4 2 55 10 11 12 13 55 54 57 548 58.2 56 10

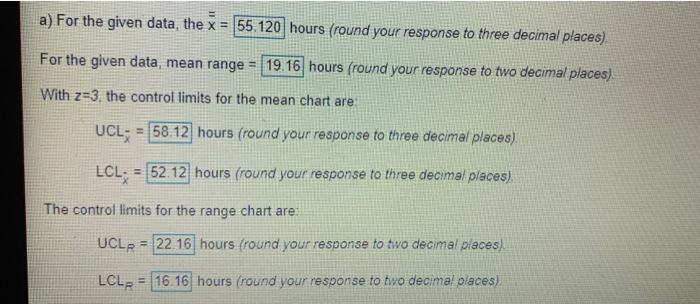
Step by Step Solution

There are 3 Steps involved in it

1 Expert Approved Answer
Step: 1 Unlock blur-text-image
Question Has Been Solved by an Expert!

Get step-by-step solutions from verified subject matter experts

Step: 2 Unlock
Step: 3 Unlock

Students Have Also Explored These Related General Management Questions!