

Question: Can someone help me answer this question using R? Use the following data: Conc. Hours 0.07 9.0 0.09 9.0 0.08 9.0 0.16 7.0 0.17 7.0
Can someone help me answer this question using R?
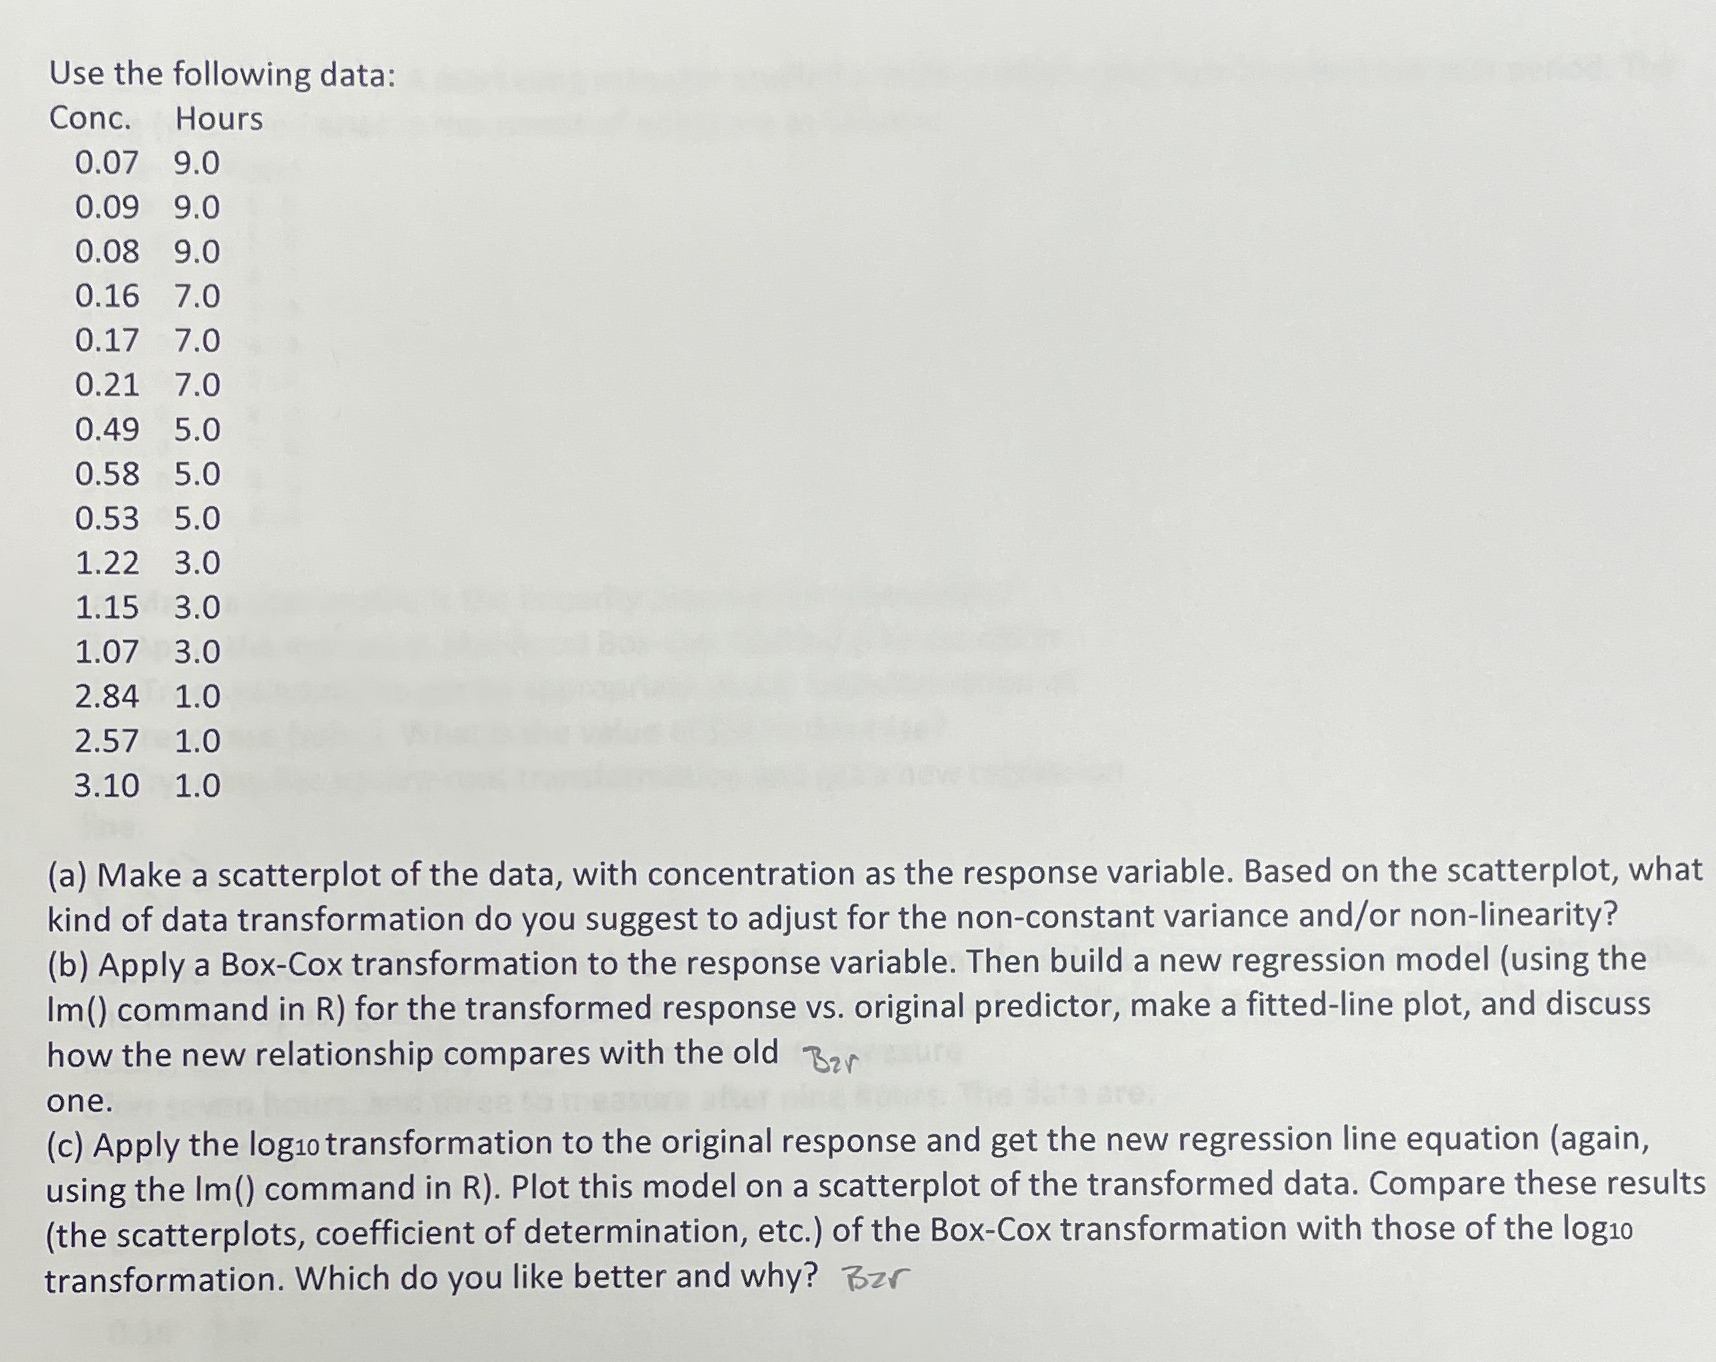
Use the following data: Conc. Hours 0.07 9.0 0.09 9.0 0.08 9.0 0.16 7.0 0.17 7.0 0.21 7.0 0.49 5.0 0.58 5.0 0.53 5.0 1.22 3.0 1.15 3.0 1.07 3.0 2.84 1.0 2.57 1.0 3.10 1.0 (a) Make a scatterplot of the data, with concentration as the response variable. Based on the scatterplot, what kind of data transformation do you suggest to adjust for the non-constant variance and/or non-linearity? (b) Apply a Box-Cox transformation to the response variable. Then build a new regression model (using the Im() command in R) for the transformed response vs. original predictor, make a fitted-line plot, and discuss how the new relationship compares with the old Bar one. (c) Apply the logio transformation to the original response and get the new regression line equation (again, using the Im() command in R). Plot this model on a scatterplot of the transformed data. Compare these results (the scatterplots, coefficient of determination, etc.) of the Box-Cox transformation with those of the log10 transformation. Which do you like better and why? Bar
Step by Step Solution
There are 3 Steps involved in it

Get step-by-step solutions from verified subject matter experts