

Question: Can someone help me code this in c++ format with this exact file output and provide the sample output that you got? I need the
Can someone help me code this in c++ format with this exact file output and provide the sample output that you got? I need the file output to be in this format,
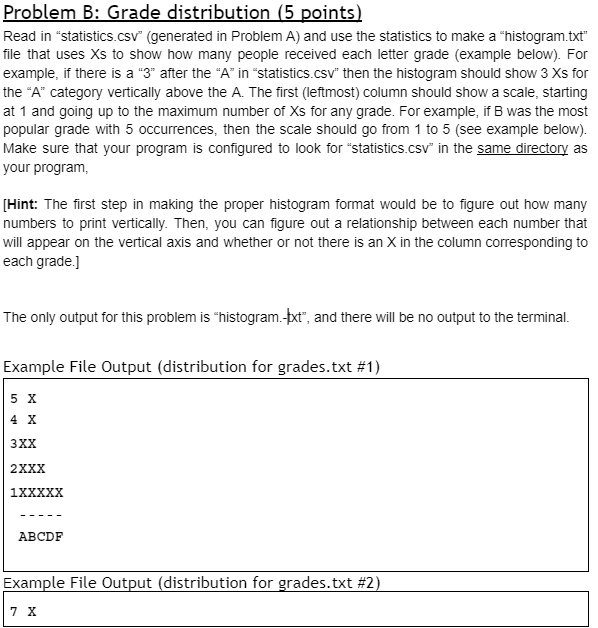
5 X 4 X 3XX 2XXX 1XXXXX ----- ABCDF
when it is printed into the histogram, NOT an output of A B C D F
****This is the grade.txt (#1) that has been provided
John Watson 43 Sherlock Holmes 92 Violet Crawley 83 Greg Lestrade 74 Missus Hudson 85 Jim Moriarty 99.99999999999 Molly Hooper 65 Irene Adler 91 Mycroft Holmes 82 Tom Branson 83 John Bates 89 Mister Carson 79
****This is the grade.txt (#2) that has been provided
Kelden Amadiro 57 Daneel Olivaw 89.0 Elijah Baley 84 Giskard Reventlov 88.8 Alfred Lanning 68 Susan Calvin 94 Han Fastolfe 92 Gregory Powell 73 Mike Donovan 67 Laurance Robertson 76 Hari Seldon 98 Dors Venabili 82 Eto Demerzel 89.0 Raych Seldon 78 Salvor Hardin 86 Yugo Amaryl 96 Ebling Mis 87
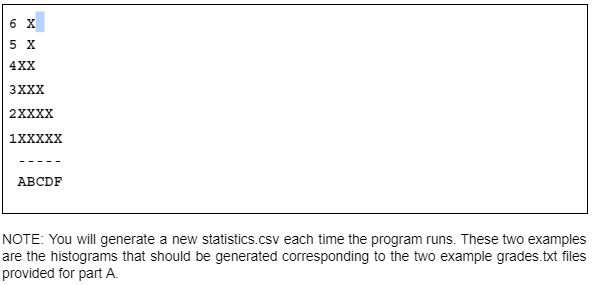
Read in "statistics.csv" (generated in Problem A) and use the statistics to make a "histogram.txt" file that uses X s to show how many people received each letter grade (example below). For example, if there is a "3" after the "A" in "statistics.Csv" then the histogram should show 3Xs for the "A" category vertically above the A. The first (leftmost) column should show a scale, starting at 1 and going up to the maximum number of Xs for any grade. For example, if B was the most popular grade with 5 occurrences, then the scale should go from 1 to 5 (see example below). Make sure that your program is configured to look for "statistics.csv" in the same directory as your program, [Hint: The first step in making the proper histogram format would be to figure out how many numbers to print vertically. Then, you can figure out a relationship between each number that will appear on the vertical axis and whether or not there is an X in the column corresponding to each grade.] The only output for this problem is "histogram. - fxt", and there will be no output to the terminal. NOTE: You will generate a new statistics.csv each time the program runs. These two examples are the histograms that should be generated corresponding to the two example grades.txt files provided for part A
Step by Step Solution
There are 3 Steps involved in it

Get step-by-step solutions from verified subject matter experts