

Question: Can someone help me explain at least 2 major statistical findings using this chart as if I were explaining them to the scientific community? It
Can someone help me explain at least 2major statistical findingsusing this chart as if I were explaining them to the scientific community? It does not have to be in great detail - only 7 sentences or so. I have found this course to be extremely challenging. I understand the results of this study. I'm just not sure how to word it in the proper scientific or statistical terms. The topic is about Police Striking Adults in comparison to white, black and other races. Thank you for any help!
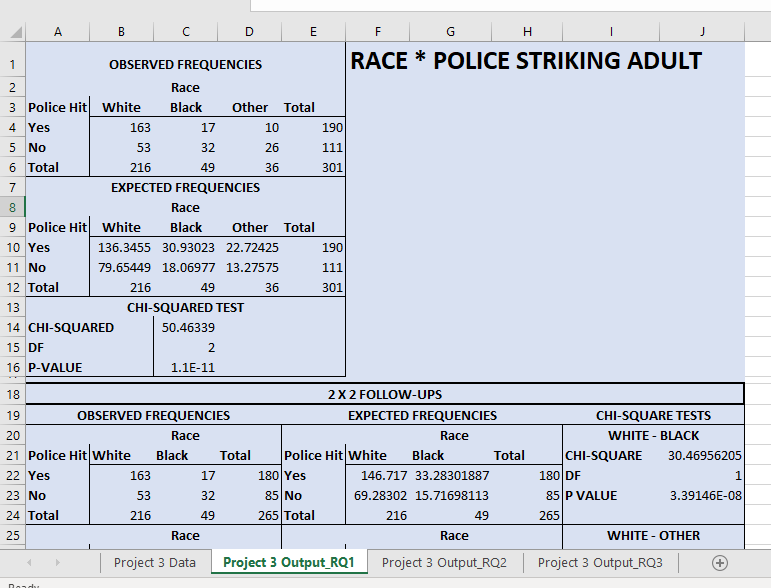
A B C D E F G H OBSERVED FREQUENCIES RACE * POLICE STRIKING ADULT 2 Race 3 Police Hit White Black Other Total Yes 163 17 10 190 5 No 53 32 26 111 Total 216 49 36 301 7 EXPECTED FREQUENCIES 8 Race 9 Police Hit White Black Other Total 10 Yes 136.3455 30.93023 22.72425 190 11 No 79.65449 18.06977 13.27575 111 12 Total 216 49 36 301 13 CHI-SQUARED TEST 14 CHI-SQUARED 50.46339 15 DF 2 16 P-VALUE 1.1E-11 18 2 X 2 FOLLOW-UPS 19 OBSERVED FREQUENCIES EXPECTED FREQUENCIES CHI-SQUARE TESTS 20 Race Race WHITE - BLACK 21 Police Hit White Black Total Police Hit White Black Total CHI-SQUARE 30.46956205 22 Yes 163 17 180 Yes 146.717 33.28301887 180 DF 23 No 53 32 85 No 69.28302 15.71698113 85 P VALUE 3.39146E-08 24 Total 216 49 265 Total 216 49 265 25 Race Race WHITE - OTHER Project 3 Data Project 3 Output RQ1 Project 3 Output_RQ2 Project 3 Output_RQ3 (+)
Step by Step Solution
There are 3 Steps involved in it

Get step-by-step solutions from verified subject matter experts