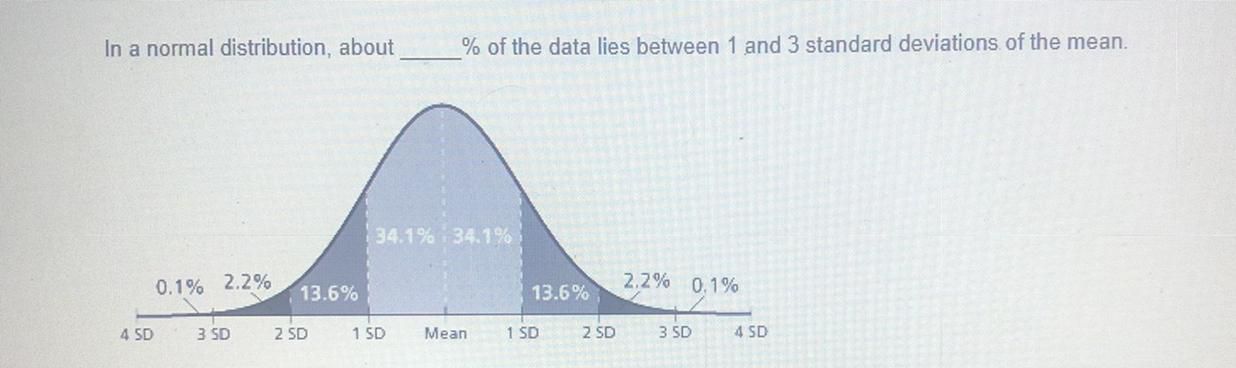
Question: Can someone help me, I don't understand In a normal distribution, about % of the data lies between 1 and 3 standard deviations of the

Can someone help me, I don't understand

Can someone help me, I don't understand In aCan someone help me, I don't understand In aCan someone help me, I don't understand In a
In a normal distribution, about % of the data lies between 1 and 3 standard deviations of the mean. 34.1% : 34.1% 0.1% 2.2% 13.6% 13.6% 2.2% 0.1% 4 5D 3 SD 2 SD 1 5D Mean 1 SD 2 SD 3 5D 4 SDThe stacked area graph shows the GDP of a country by sector from 1960 to 2010 Use the stacked area graph to complete the following statement using increased or decreased. From 1960 to 2010, the percent of the country's GDP from the service sector GDP of a Country Agricultural Percent of GDP Service Industrial 20 1960 1945 1970 1975 1950 1985 1990 1895 2000 2005 2010 YearThe histogram shows the high temperatures for a city in July. Complete the statement using less or more There are temperatures that are 80 F or above than 79 F or below High Temperatures for a City in July 10 1 Frequency 70 75 80 85 90 95 100 Temperature (OF)

Step by Step Solution

There are 3 Steps involved in it

1 Expert Approved Answer
Step: 1 Unlock blur-text-image
Question Has Been Solved by an Expert!

Get step-by-step solutions from verified subject matter experts

Step: 2 Unlock
Step: 3 Unlock

Students Have Also Explored These Related Mathematics Questions!