

Question: can someone help me including graph. 1. A lab is trying to determine how many test kits it should order from its supplier. They use
can someone help me including graph. 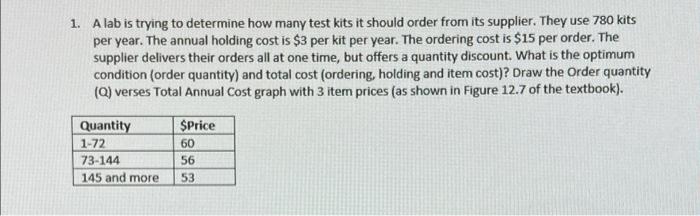
1. A lab is trying to determine how many test kits it should order from its supplier. They use 780 kits per year. The annual holding cost is $3 per kit per year. The ordering cost is $15 per order. The supplier delivers their orders all at one time, but offers a quantity discount. What is the optimum condition (order quantity) and total cost (ordering, holding and item cost)? Draw the Order quantity (Q) verses Total Annual Cost graph with 3 item prices (as shown in Figure 12.7 of the textbook). $Price Quantity 1-72 60 73-144 56 145 and more 53
Step by Step Solution
There are 3 Steps involved in it
1 Expert Approved Answer
Step: 1 Unlock

Question Has Been Solved by an Expert!
Get step-by-step solutions from verified subject matter experts
Step: 2 Unlock
Step: 3 Unlock