

Question: can someone help me out with this question, or do it on excel to show me a picture of the final result please. would really
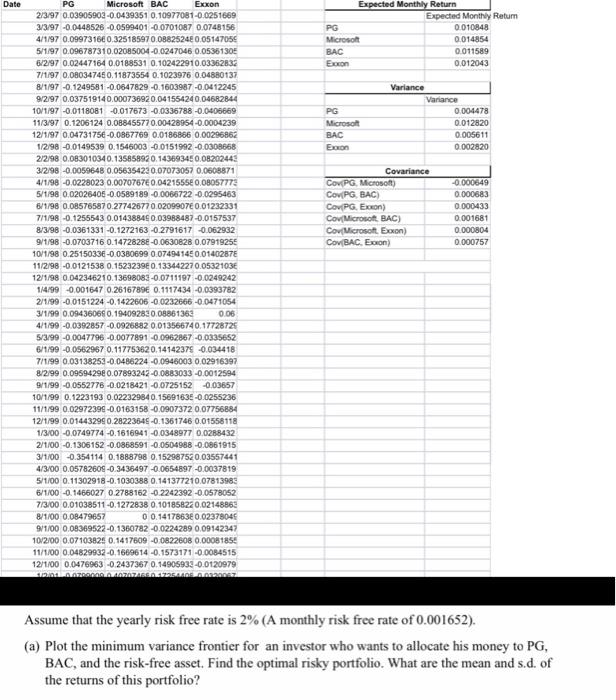
Date Expected Monthly Return Expected Monthly Retum PG 0.010848 Microsoft 0.014854 BAC 0.011589 Econ 0,012043 PG Microsoft BAC Exion Variance Variance 0.004478 0.012820 0.005611 0.002820 Covariance Cov PG, Microsoft) Cov/PG, BAC) COV PG. Exxon) Cov/Microsoft BAC) CovMicrosoft Exxon) Cov(BAC, Exton) -0.000649 0.000683 0.000433 0.001681 0.000804 0.000757 PG Microsoft BAC Exxon 2/3/97 0.03905902-0.0439351 0.10977081-0.0251669 3/3/97 -0.0448526 -0.0599401 -0.0701087 0.0748156 4/1/97 0.099731660.32518597 0,08825248 0.05147055 5/1/97 0.096787310.02085004-0.0247046 0.05361305 6/2/97 0.02447164 0.0188531 0.102422910.03362832 7/1/97 0.080347450.11873554 0.1023976 0.04880137 8/1/97 -0.1249581 -0.0647829-0.1603987 -0.0412245 9/2/97 0.037519140.000736920.041554240.04682844 10/1/97 -0.0118081 -0.017673 -0.0336788 -0.0405669 11/3/97 0.1206124 0.088455770.00428954 -0.0004239 12/1/97 0.0473175 -0.0867769 0.0186866 0.00296862 1/2/98 -0.0149539 0.1546003 -0.0151992 -0.0308668 2/2/98 0.083010340.135858920.14369345 0.08202443 3/2/98 -0.0059648 0.056354230.07073057 0.0508871 4/1/98 -0.0228023 0.0070767 0.0421555 0.08057773 5/1/98 0.02026405-0.0589189 -0.0066722 -0.0295463 6/1/98 0.08576587 0.277426770.0209907 0.01232331 7/1/98 -0.1255543 0.01438845 0.03988487-0.0157537 8/3/98 -0.0361331 -0.1272163 -0.2791617 0.062932 9/1/98 -0.0703716 0.14728288 -0.0630628 0.0791925 10/1/98 0.25150338 -0.0380699 0.07494145 0.0140287E 11/2/98 -0.0121538 0.1523239 0.133442270.0532103E 12/1/98 0.042346210.13698083-0.0711197 -0.0249242 1/4/99 -0.001647 0.2616789 0.1117434 -0.0393782 2/1/99 -0.0151224 -0.1422606 -0.0232666 -0.0471054 3/1/99 0.09436068 0.194092820.08861363 0.06 4/1/99 -0.0392857 -0.0926882 0.013566740.17728725 5/3/99-0.0047796 -0.0077891 -0.0962867 -0.0335652 6/1/99 -0.0562967 0.117753620.14142375 -0.034418 7/1/99 0.03138253-0.0486224 -0.0946003 0.02916397 8/2/99 0.09594298 0.07893242-0.0883033 -0.0012594 9/1/99 -0.0552776 -0.0218421 -0.0725152 -0.03657 10/1/99 0.1223193 0.022329840.15691635 -0.0255236 11/1/99 0.02972398 -0.0163158 -0.0907372 0.07756884 12/1/99 0.01443299 0.28223648 -0.1361746 0.01558118 1/3/00 -0,0749774 -0.1616941 -0.0348977 0.0288432 2/1/00 -0.1306152-0.0868591 -0.0504988 -0.0861915 3/1/00 -0.354114 0.1888798 0.15298752 0.03557441 4/3/00 0.05782609 -0.3436497 -0.0654897 -0.0037819 5/1/00 0.11302918 -0.1030388 0.141377210.07813983 6/1/00 -0.1466027 02788162 -02242392 -0.0578052 7/3/00 0.01038511-0.1272838 0.101858220.02148863 8/1/00 0.08479657 0 0.14178638 0.02378045 9/1/00 0,08369522-0.1360782 -0.0224289 0.09142347 10/2/00 0.07103825 0.1417609 -0.0822608 0.00081856 11/1/00 0.04829932-0.1669614 -0.1573171 -0.0084515 12/1/00 0.0476963 -0.2437367 0.14905933-0.0120979 LAATRACONAZOZASSACHS AGO Assume that the yearly risk free rate is 2% (A monthly risk free rate of 0.001652). (a) Plot the minimum variance frontier for an investor who wants to allocate his money to PG, BAC, and the risk-free asset. Find the optimal risky portfolio. What are the mean and s.d. of the returns of this portfolio? Date Expected Monthly Return Expected Monthly Retum PG 0.010848 Microsoft 0.014854 BAC 0.011589 Econ 0,012043 PG Microsoft BAC Exion Variance Variance 0.004478 0.012820 0.005611 0.002820 Covariance Cov PG, Microsoft) Cov/PG, BAC) COV PG. Exxon) Cov/Microsoft BAC) CovMicrosoft Exxon) Cov(BAC, Exton) -0.000649 0.000683 0.000433 0.001681 0.000804 0.000757 PG Microsoft BAC Exxon 2/3/97 0.03905902-0.0439351 0.10977081-0.0251669 3/3/97 -0.0448526 -0.0599401 -0.0701087 0.0748156 4/1/97 0.099731660.32518597 0,08825248 0.05147055 5/1/97 0.096787310.02085004-0.0247046 0.05361305 6/2/97 0.02447164 0.0188531 0.102422910.03362832 7/1/97 0.080347450.11873554 0.1023976 0.04880137 8/1/97 -0.1249581 -0.0647829-0.1603987 -0.0412245 9/2/97 0.037519140.000736920.041554240.04682844 10/1/97 -0.0118081 -0.017673 -0.0336788 -0.0405669 11/3/97 0.1206124 0.088455770.00428954 -0.0004239 12/1/97 0.0473175 -0.0867769 0.0186866 0.00296862 1/2/98 -0.0149539 0.1546003 -0.0151992 -0.0308668 2/2/98 0.083010340.135858920.14369345 0.08202443 3/2/98 -0.0059648 0.056354230.07073057 0.0508871 4/1/98 -0.0228023 0.0070767 0.0421555 0.08057773 5/1/98 0.02026405-0.0589189 -0.0066722 -0.0295463 6/1/98 0.08576587 0.277426770.0209907 0.01232331 7/1/98 -0.1255543 0.01438845 0.03988487-0.0157537 8/3/98 -0.0361331 -0.1272163 -0.2791617 0.062932 9/1/98 -0.0703716 0.14728288 -0.0630628 0.0791925 10/1/98 0.25150338 -0.0380699 0.07494145 0.0140287E 11/2/98 -0.0121538 0.1523239 0.133442270.0532103E 12/1/98 0.042346210.13698083-0.0711197 -0.0249242 1/4/99 -0.001647 0.2616789 0.1117434 -0.0393782 2/1/99 -0.0151224 -0.1422606 -0.0232666 -0.0471054 3/1/99 0.09436068 0.194092820.08861363 0.06 4/1/99 -0.0392857 -0.0926882 0.013566740.17728725 5/3/99-0.0047796 -0.0077891 -0.0962867 -0.0335652 6/1/99 -0.0562967 0.117753620.14142375 -0.034418 7/1/99 0.03138253-0.0486224 -0.0946003 0.02916397 8/2/99 0.09594298 0.07893242-0.0883033 -0.0012594 9/1/99 -0.0552776 -0.0218421 -0.0725152 -0.03657 10/1/99 0.1223193 0.022329840.15691635 -0.0255236 11/1/99 0.02972398 -0.0163158 -0.0907372 0.07756884 12/1/99 0.01443299 0.28223648 -0.1361746 0.01558118 1/3/00 -0,0749774 -0.1616941 -0.0348977 0.0288432 2/1/00 -0.1306152-0.0868591 -0.0504988 -0.0861915 3/1/00 -0.354114 0.1888798 0.15298752 0.03557441 4/3/00 0.05782609 -0.3436497 -0.0654897 -0.0037819 5/1/00 0.11302918 -0.1030388 0.141377210.07813983 6/1/00 -0.1466027 02788162 -02242392 -0.0578052 7/3/00 0.01038511-0.1272838 0.101858220.02148863 8/1/00 0.08479657 0 0.14178638 0.02378045 9/1/00 0,08369522-0.1360782 -0.0224289 0.09142347 10/2/00 0.07103825 0.1417609 -0.0822608 0.00081856 11/1/00 0.04829932-0.1669614 -0.1573171 -0.0084515 12/1/00 0.0476963 -0.2437367 0.14905933-0.0120979 LAATRACONAZOZASSACHS AGO Assume that the yearly risk free rate is 2% (A monthly risk free rate of 0.001652). (a) Plot the minimum variance frontier for an investor who wants to allocate his money to PG, BAC, and the risk-free asset. Find the optimal risky portfolio. What are the mean and s.d. of the returns of this portfolio
Step by Step Solution
There are 3 Steps involved in it

Get step-by-step solutions from verified subject matter experts