

Question: Can someone help me out with this? The data being used is Yale Admits, and this is the link of the file so you can

Can someone help me out with this? The data being used is Yale Admits, and this is the link of the file so you can have access to the data: https://docs.google.com/spreadsheets/d/1qaA2Eo-EqckTxOQQcy7lCC_y_mBEWW3qTD3xU6rghK4/edit?usp=sharing


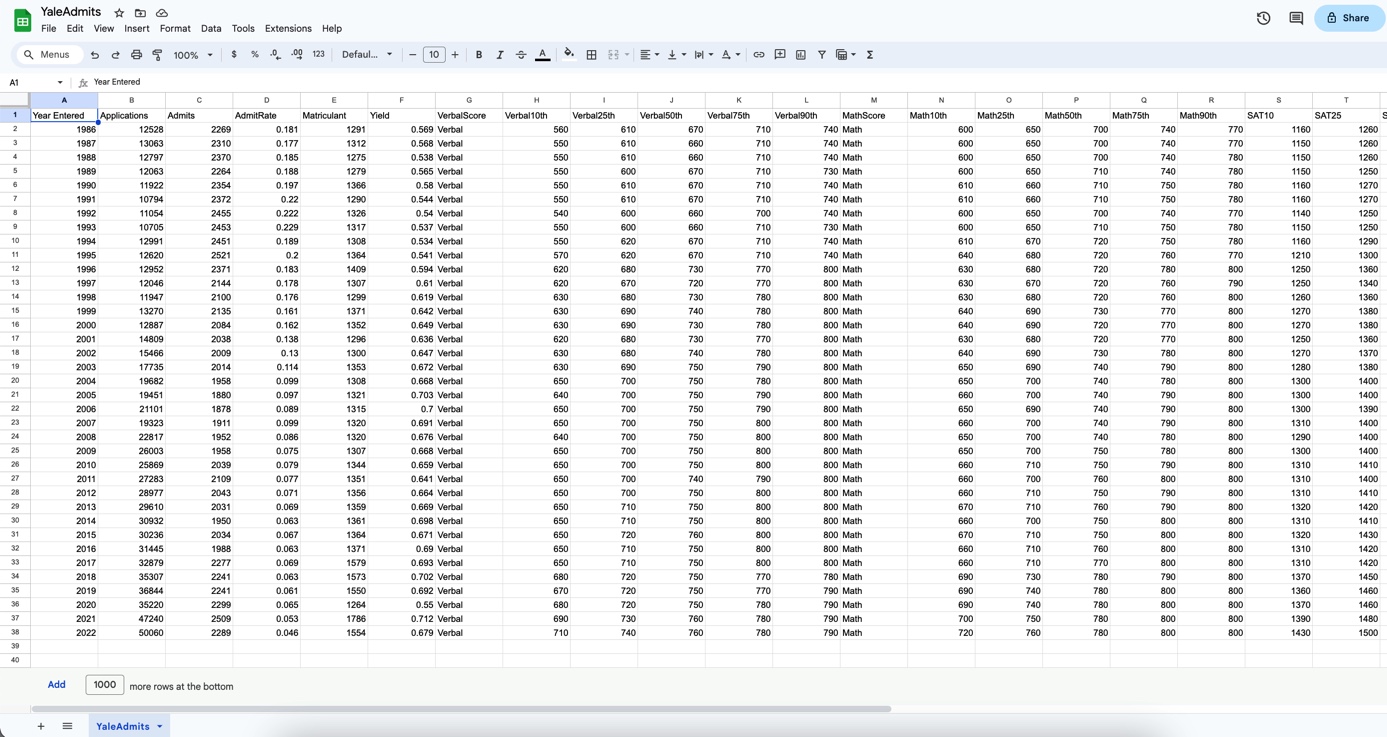
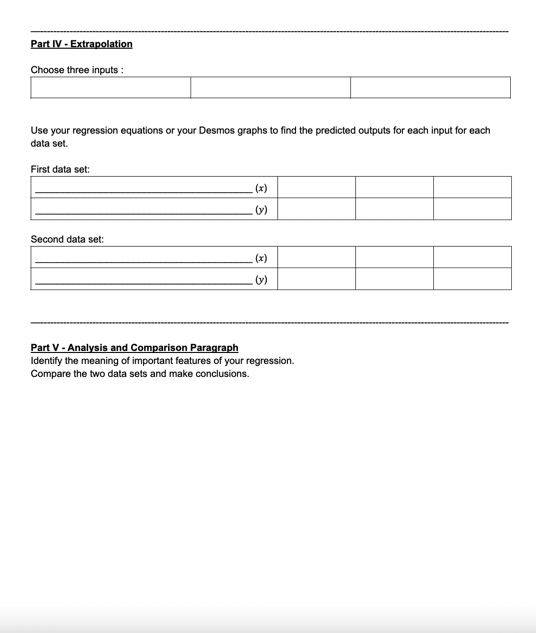
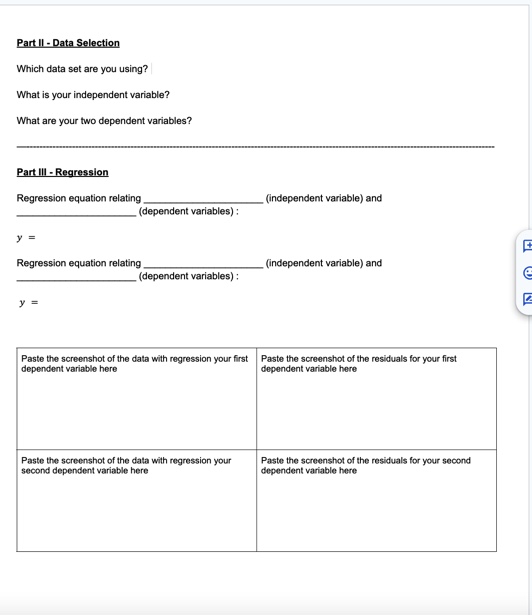
Part IV - Extrapolation Choose three inputs : Use your regression equations or your Desmos graphs to find the predicted outputs for each input for each data set. First data set: (x) (y) Second data set: (x) (y) Part V - Analysis and Comparison Paragraph Identify the meaning of important features of your regression. Compare the two data sets and make conclusions.Part IV - Extrapolation Choose three inputs : Use your regression equations or your Desmos graphs to find the predicted outputs for each input for each data set. First data set: (x) (y) Second data set: (x) (y) Part V - Analysis and Comparison Paragraph Identify the meaning of important features of your regression. Compare the two data sets and make conclusions.Part II - Data Selection Which data set are you using? What is your independent variable? What are your two dependent variables? Part Ill - Regression Regression equation relating (independent variable) and (dependent variables) : Regression equation relating (independent variable) and (dependent variables) : y Paste the screenshot of the data with regression your first Paste the screenshot of the residuals for your first dependent variable here dependent variable here Paste the screenshot of the data with regression your Paste the screenshot of the residuals for your second second dependent variable here dependent variable herePart II - Data Selection Which data set are you using? What is your independent variable? What are your two dependent variables? Part Ill - Regression Regression equation relating (independent variable) and (dependent variables) : Regression equation relating (independent variable) and (dependent variables) : y Paste the screenshot of the data with regression your first Paste the screenshot of the residuals for your first dependent variable here dependent variable here Paste the screenshot of the data with regression your Paste the screenshot of the residuals for your second second dependent variable here dependent variable hereShare YaleAdmits * D & File Edit View Insert Format Data Tools Extensions Help - 10 + B IA Q. Menus b e 5 5 100% - $ % .0 09 123 Default - R S 0 A fix Year Entered K SAT25 G H Math50th Math75th Math90th SAT10 D Math25th Verbal75th Verbal90th MathScore Math10th 1160 1260 Matriculant Yield VerbalScore Verbal10th Verbal25th Verbal50th 770 600 350 700 740 1260 Year Entered Applications Admits AdmitRate 670 710 740 Math 610 740 1150 700 770 12528 2269 0.181 1291 0.569 Verbal 560 740 Math 650 1986 650 610 660 710 650 700 740 780 1150 1260 231 0.177 1312 0.568 Verbal 600 1987 13063 0.538 Verbal 550 610 660 710 740 Math 710 740 780 1150 1250 12797 2370 0.185 1275 600 670 710 730 Math 650 1988 710 750 780 1160 1270 2063 2264 0.186 1279 0.565 Verbal 550 740 Math 310 660 1270 1989 1366 0.58 Verbal 550 610 670 710 740 Math 660 710 750 780 1160 0.197 610 1990 1922 235 550 610 670 710 650 700 740 770 1140 1250 10794 2372 0.22 1290 0.544 Verbal 600 700 600 1250 1991 0.54 Verbal 540 660 740 Math 1150 0.222 1326 730 Math 300 650 710 750 780 1992 11054 2455 550 600 660 710 750 780 1160 1290 2453 0.229 1317 0.537 Verbal 10705 620 670 710 740 Math 610 670 720 1300 1993 1308 0.534 Verbal 550 740 Math 680 720 760 770 1210 1994 12991 2451 0.189 570 620 670 710 0.541 Verbal 630 680 720 780 800 1250 1360 1995 12620 2521 0.2 1364 680 730 800 Math 0.594 Verbal 620 770 1340 1409 630 670 720 760 790 1250 1996 2952 2371 0.183 620 670 720 770 800 Math 680 720 760 1260 1360 630 1997 12046 2144 0,178 1307 0.61 Verbal 630 680 730 780 800 Math 770 800 1270 1380 1194 2100 D,176 1299 0.619 Verbal 690 740 780 800 Math 640 690 730 800 1380 1998 0.642 Verbal 630 640 690 720 770 1270 1999 13270 2135 0,161 1371 730 780 800 Math 800 1250 1360 0,162 1352 0.649 Verbal 630 690 770 12887 2084 620 680 730 770 800 Math 630 680 720 2000 1296 0.636 Verbal 640 690 730 780 1270 1370 2001 14809 2038 D.138 740 800 Math 630 680 780 690 740 790 800 1280 1380 0.13 1300 0.647 Verbal 750 790 800 Math 650 2002 15466 200 630 690 700 740 780 800 1300 1400 650 2003 17735 2014 D.114 1353 0.672 Verbal 800 Math 1308 0.668 Verbal 650 700 750 780 660 700 740 790 800 1300 1400 19682 1958 0.098 750 790 800 Math 790 800 1300 1390 2004 19451 1880 D.097 1321 0.703 Verbal 640 790 800 Math 690 740 650 750 650 2005 740 790 800 1310 1400 2006 21101 1878 0.089 1315 0.7 Verbal 660 700 1320 0.691 Verbal 650 700 750 800 800 Math 780 1290 1400 740 800 9323 1911 0.099 2007 640 750 800 800 Math 650 700 700 750 780 800 1300 1400 22817 1320 800 800 Math 650 2008 1952 D.086 0.676 Verbal 800 1310 1410 1307 0.668 Verbal 650 750 660 710 750 790 2009 26003 1958 0.075 700 800 Math 0.659 Verbal 650 750 800 660 700 760 800 800 1310 1400 2010 25869 2039 D.079 1344 1351 0.641 Verbal 650 700 740 790 800 Math 1310 1410 D.077 750 800 800 Math 660 710 750 790 2011 27283 2109 1356 0.664 Verbal 650 670 710 760 790 800 1320 1420 2012 2897 2043 0.071 1359 0.669 Verbal 650 710 750 800 800 Math 1410 0.069 800 Math 660 700 750 800 800 1310 2013 29610 2031 750 800 800 1320 1430 1950 D.063 1361 0.698 Verbal 650 710 670 710 750 800 2014 30932 1364 0.671 Verbal 650 720 760 800 800 Math 760 800 800 1310 1420 2015 30236 2034 0.067 800 660 710 650 710 750 800 Math 710 770 800 800 1310 1420 0.69 Verbal 2016 31445 1988 D.063 1371 650 710 750 800 800 Math 660 1370 1450 0.069 1579 0.693 Verbal 780 Math 690 730 780 790 800 1460 2017 32879 2277 750 770 800 1360 2241 0.063 1573 0.702 Verbal 680 720 690 740 780 800 2018 35307 1550 0.692 Verbal 670 720 750 770 790 Math 1460 690 740 780 800 800 1370 2019 36844 2241 0.061 790 Math 1480 1264 720 750 780 1390 700 750 780 800 800 0.55 Verbal 680 1500 2020 35220 2299 0.065 760 780 790 Math 800 800 1430 47240 2509 0.053 1786 0.712 Verbal 690 730 780 2021 710 740 760 780 790 Math 720 760 2022 50060 2289 0.046 1554 0.679 Verbal Add 1000 more rows at the bottom YaleAdmits *Share YaleAdmits * D & File Edit View Insert Format Data Tools Extensions Help - 10 + B IA Q. Menus b e 5 5 100% - $ % .0 09 123 Default - R S 0 A fix Year Entered K SAT25 G H Math50th Math75th Math90th SAT10 D Math25th Verbal75th Verbal90th MathScore Math10th 1160 1260 Matriculant Yield VerbalScore Verbal10th Verbal25th Verbal50th 770 600 350 700 740 1260 Year Entered Applications Admits AdmitRate 670 710 740 Math 610 740 1150 700 770 12528 2269 0.181 1291 0.569 Verbal 560 740 Math 650 1986 650 610 660 710 650 700 740 780 1150 1260 231 0.177 1312 0.568 Verbal 600 1987 13063 0.538 Verbal 550 610 660 710 740 Math 710 740 780 1150 1250 12797 2370 0.185 1275 600 670 710 730 Math 650 1988 710 750 780 1160 1270 2063 2264 0.186 1279 0.565 Verbal 550 740 Math 310 660 1270 1989 1366 0.58 Verbal 550 610 670 710 740 Math 660 710 750 780 1160 0.197 610 1990 1922 235 550 610 670 710 650 700 740 770 1140 1250 10794 2372 0.22 1290 0.544 Verbal 600 700 600 1250 1991 0.54 Verbal 540 660 740 Math 1150 0.222 1326 730 Math 300 650 710 750 780 1992 11054 2455 550 600 660 710 750 780 1160 1290 2453 0.229 1317 0.537 Verbal 10705 620 670 710 740 Math 610 670 720 1300 1993 1308 0.534 Verbal 550 740 Math 680 720 760 770 1210 1994 12991 2451 0.189 570 620 670 710 0.541 Verbal 630 680 720 780 800 1250 1360 1995 12620 2521 0.2 1364 680 730 800 Math 0.594 Verbal 620 770 1340 1409 630 670 720 760 790 1250 1996 2952 2371 0.183 620 670 720 770 800 Math 680 720 760 1260 1360 630 1997 12046 2144 0,178 1307 0.61 Verbal 630 680 730 780 800 Math 770 800 1270 1380 1194 2100 D,176 1299 0.619 Verbal 690 740 780 800 Math 640 690 730 800 1380 1998 0.642 Verbal 630 640 690 720 770 1270 1999 13270 2135 0,161 1371 730 780 800 Math 800 1250 1360 0,162 1352 0.649 Verbal 630 690 770 12887 2084 620 680 730 770 800 Math 630 680 720 2000 1296 0.636 Verbal 640 690 730 780 1270 1370 2001 14809 2038 D.138 740 800 Math 630 680 780 690 740 790 800 1280 1380 0.13 1300 0.647 Verbal 750 790 800 Math 650 2002 15466 200 630 690 700 740 780 800 1300 1400 650 2003 17735 2014 D.114 1353 0.672 Verbal 800 Math 1308 0.668 Verbal 650 700 750 780 660 700 740 790 800 1300 1400 19682 1958 0.098 750 790 800 Math 790 800 1300 1390 2004 19451 1880 D.097 1321 0.703 Verbal 640 790 800 Math 690 740 650 750 650 2005 740 790 800 1310 1400 2006 21101 1878 0.089 1315 0.7 Verbal 660 700 1320 0.691 Verbal 650 700 750 800 800 Math 780 1290 1400 740 800 9323 1911 0.099 2007 640 750 800 800 Math 650 700 700 750 780 800 1300 1400 22817 1320 800 800 Math 650 2008 1952 D.086 0.676 Verbal 800 1310 1410 1307 0.668 Verbal 650 750 660 710 750 790 2009 26003 1958 0.075 700 800 Math 0.659 Verbal 650 750 800 660 700 760 800 800 1310 1400 2010 25869 2039 D.079 1344 1351 0.641 Verbal 650 700 740 790 800 Math 1310 1410 D.077 750 800 800 Math 660 710 750 790 2011 27283 2109 1356 0.664 Verbal 650 670 710 760 790 800 1320 1420 2012 2897 2043 0.071 1359 0.669 Verbal 650 710 750 800 800 Math 1410 0.069 800 Math 660 700 750 800 800 1310 2013 29610 2031 750 800 800 1320 1430 1950 D.063 1361 0.698 Verbal 650 710 670 710 750 800 2014 30932 1364 0.671 Verbal 650 720 760 800 800 Math 760 800 800 1310 1420 2015 30236 2034 0.067 800 660 710 650 710 750 800 Math 710 770 800 800 1310 1420 0.69 Verbal 2016 31445 1988 D.063 1371 650 710 750 800 800 Math 660 1370 1450 0.069 1579 0.693 Verbal 780 Math 690 730 780 790 800 1460 2017 32879 2277 750 770 800 1360 2241 0.063 1573 0.702 Verbal 680 720 690 740 780 800 2018 35307 1550 0.692 Verbal 670 720 750 770 790 Math 1460 690 740 780 800 800 1370 2019 36844 2241 0.061 790 Math 1480 1264 720 750 780 1390 700 750 780 800 800 0.55 Verbal 680 1500 2020 35220 2299 0.065 760 780 790 Math 800 800 1430 47240 2509 0.053 1786 0.712 Verbal 690 730 780 2021 710 740 760 780 790 Math 720 760 2022 50060 2289 0.046 1554 0.679 Verbal Add 1000 more rows at the bottom YaleAdmits *
Step by Step Solution
There are 3 Steps involved in it

Get step-by-step solutions from verified subject matter experts