Question: Can someone help me please? Please let me know if I am missing information needed. Part III - READ ALL INSTRUCTIONS - COMPLETELY SEPARATE FROM
Can someone help me please? Please let me know if I am missing information needed.
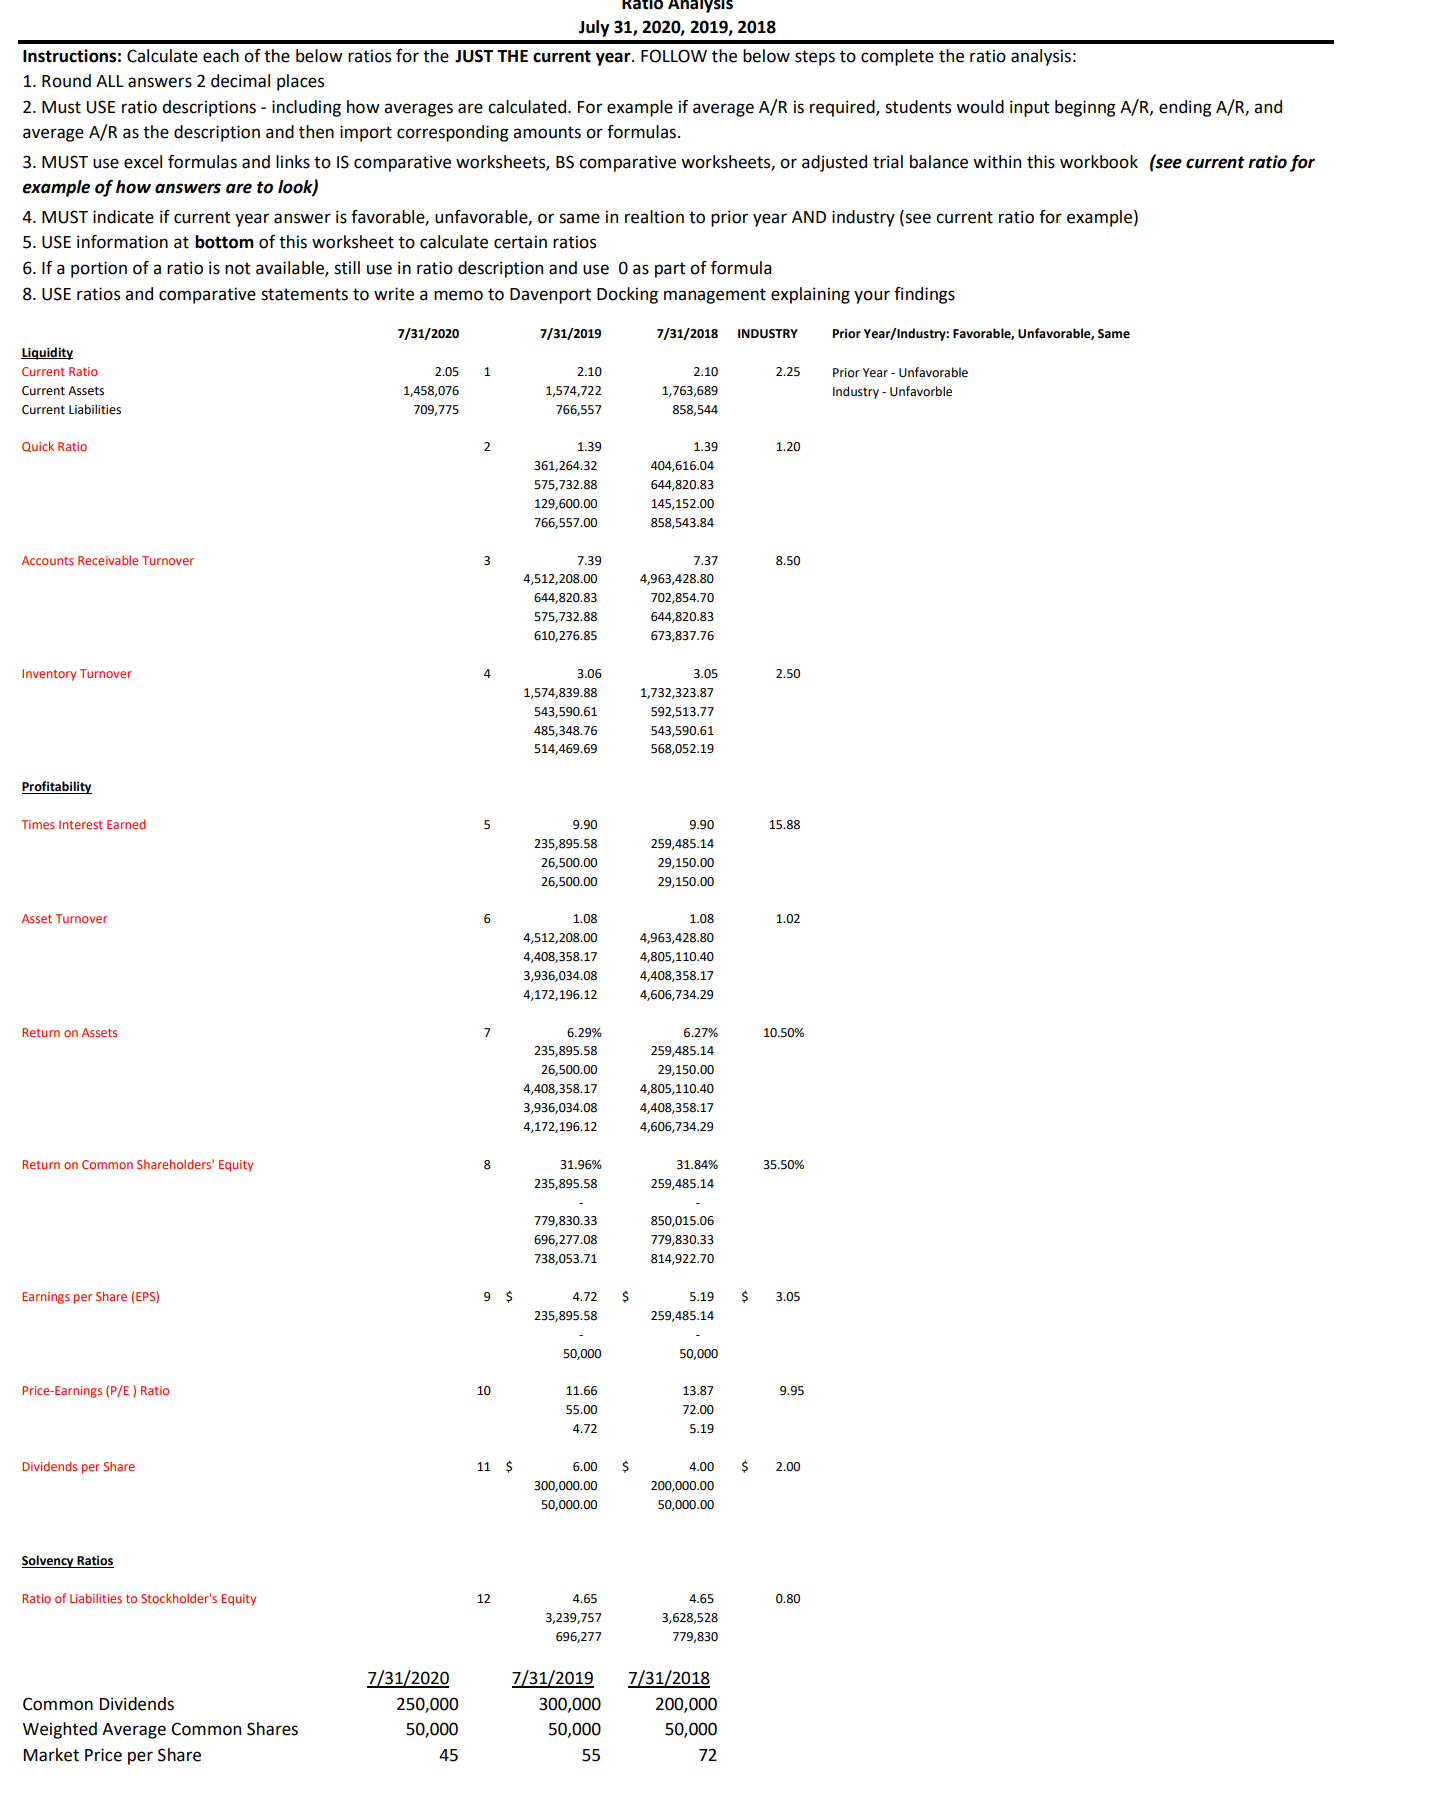
Part III - READ ALL INSTRUCTIONS - COMPLETELY SEPARATE FROM PARTS I & II a. Within this workbook there is a worksheet labeled "Adjusted Trial Balances". Within that worksheet you will find fully completed trial balances for 5 years. Also within this workbook you will find worksheets for comparative income statements and comparative balance Sheets.Using the trial balances or comparative nancial statements you need to calculate a variety of ratios. You will find the required ratios in the worksheet labeled "Ratios Historical". Complete all the required ratios AND analysis (see Ratios Historical worksheet). You MUST use formulas and/or linking to compute your ratios. You cannot Simply hard key the answers. You must reference the appropriate data from the trial balances or comparative financial statements. b. After completing all of your ratio calcualtions, analyze the results in comparison to prior years and industry averages. Write a business memo explaining your findings. Your memo must be written in Word and follow normal business memo conventions - use word memo templates for this. There is not a length requirement, however you will be graded upon the substance of your analysis. \f\fatlD Analysls July 31, 2020, 2019, 2018 Instructions: Calculate each of the below ratios for the JUST THE current year. FOLLOW the below steps to complete the ratio analysis: 1. Round ALL answers 2 decimal places 2. Must USE ratio descriptions - including how averages are calculated. For example if average AIR is required. students would input beginng A/R, ending AIR, and average AIR as the description and then import corresponding amounts or formulas. 3. MUST use excel formulas and links to IS comparative worksheets, BS comparative worksheets, or adjusted trial balance within this workbook (see current ratiofor example of how answers are to look) 4. MUST indicate if current year answer is favorable, unfavorable, or same in realtion to prior year AND industry (see current ratio for example) 5. USE information at bottom of this worksheet to calculate certain ratios 6. If a portion of a ratio is not available, still use in ratio description and use 0 as part of formula 8. USE ratios and comparative statements to write a memo to Davenport Docking management explaining your ndings 773112020 773172019 7131/2101; INDUSTRY Prlor Vearj'lndnstry: Favorable, Unfavorahle, Same uguidm Current Ratio 2.05 1 2.10 2.10 2.25 Prlor Year 7 Unfavorable Current Assets 1,453,075 1,574,722 1,763,689 Ind ustry - Unfamrble Current Liabilities 709,775 765,557 858,544 Quick Ratio 2 1.39 1.39 1.20 351,264.32 404,516.04 575,732.88 644,820.83 129,6m.00 145,152.00 755,557.00 858,543.84 Accounts Receivable Turnover 3 7.35 7.37 8.50 4,512,208.00 4,963,428.80 544,820.83 702,854.70 575,732.88 644,820.83 510,276.85 673,837.75 inventory Turnover 4 3.06 3.05 2.50 1,574,839.88 1,732,323.87 543,590.61 592,513.77 485,348.76 543,590.61 514,469.69 568,052.19 Frnflhblllg Times Interest Earned 5 9.90 9.90 15.33 235,895.58 259,485.14 25,500.00 29,150.00 25,500.00 29,150.\") Asset Turnover 6 1.08 1.08 1.02 4,512,208.00 4,963,428.80 4,408,358.17 4,305,110.40 3,935,034.08 4,408,358.17 4,172,196.12 4,606,734.29 Return on Assets 7' 5.29% 6.2796 10.5096 235,895.58 259,435.14 25,500.00 29,150.!!! 4,408,358.17 4,805,110.40 3,935,034.08 4,408,358.17 4,172,196.12 4,606,734.29 Return on Common Shareholders' Equity 8 31.96% 31.84% 35.50% 235,895.58 259,435.14 779,830.33 850,015.05 595,277.08 779,830.33 738,053.71 814,922.70 Earnings per Share (EPS! 9 S 4.72 5 5.19 S 3.05 235,895.58 259,435.14 50.900 50,000 Price-Earnings (PIE 3 Ratio 10 11.66 13.87 9.95 55.00 721!) 4.72 5.19 Dividends per Share 11 s 6.00 5 4.00 S 2.00 3001mm 200,M0.00 50,000.00 50,000.00 Solveng Ratio: Ratio ol Liabilities to Stookholder's Equity 12 4.65 4.65 0.80 3,239,757 3,628,528 695,277 779,830 7(31z2020 7131(2019 7(31z2018 Common Dividends 250,000 300,000 200,000 Weighted Average Common Shares 50,000 50,000 50,000 Market Price per Share 45 55 72