

Question: can someone help me run this in matlab. i keep getting errors Putting it all together | 1. Graph the function f(x) = x2(x2 -
can someone help me run this in matlab. i keep getting errors
![- 1)(x + 2) and its derivative in the window [-2.5,1.5] by](https://dsd5zvtm8ll6.cloudfront.net/si.experts.images/questions/2024/09/66f315ad0f864_82866f315ac8287d.jpg)
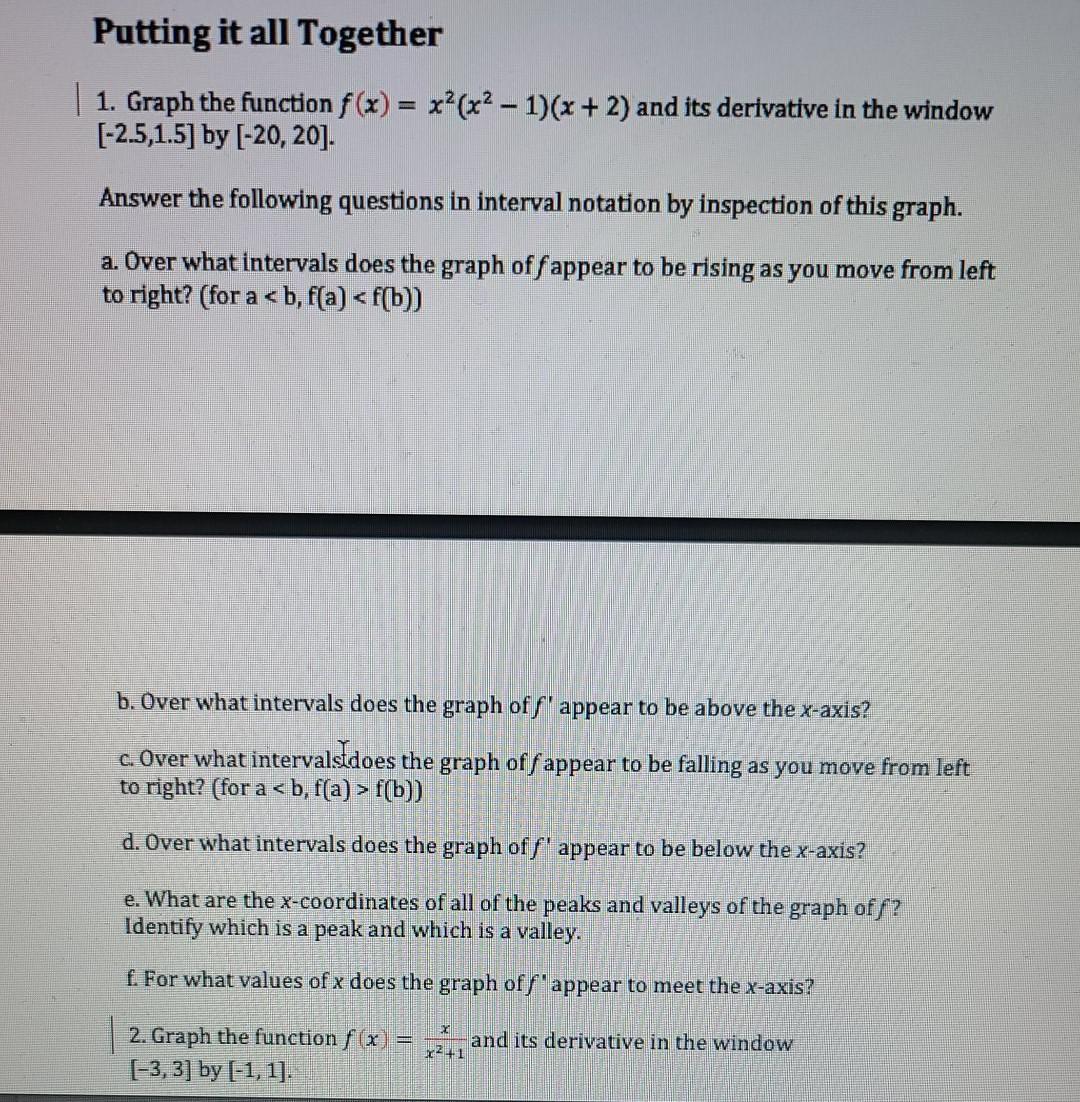
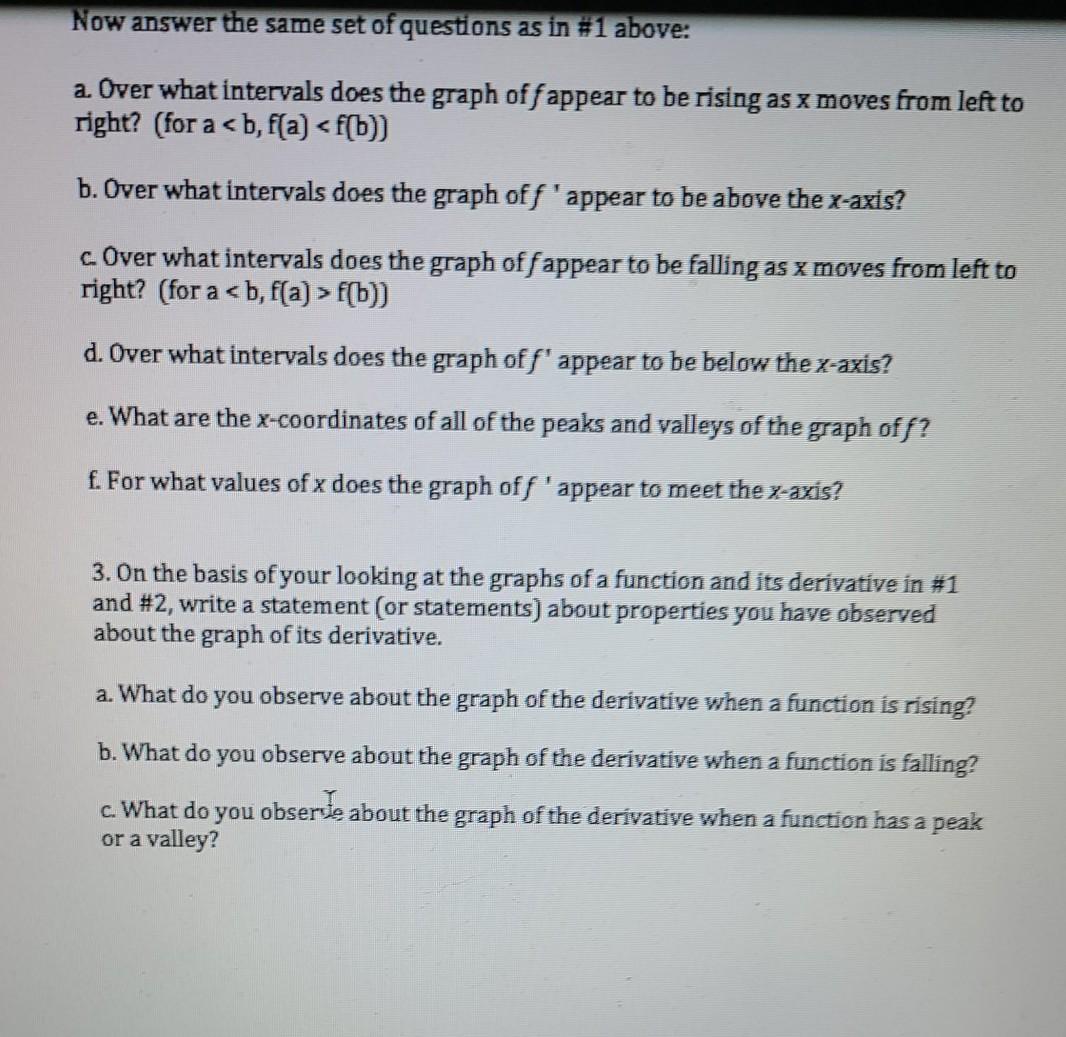
Putting it all together | 1. Graph the function f(x) = x2(x2 - 1)(x + 2) and its derivative in the window [-2.5,1.5] by [-20, 20). Answer the following questions in interval notation by inspection of this graph. a. Over what intervals does the graph off appear to be rising as you move from left to right? (for a f(b)) d. Over what intervals does the graph of' appear to be below the x-axis? e. What are the x-coordinates of all of the peaks and valleys of the graph off? Identify which is a peak and which is a valley. f. For what values of x does the graph off' appear to meet the x-axis? 2. Graph the function f (x) = and its derivative in the window 22+1 (-3,3] by [-1, 1]. 2 Now answer the same set of questions as in #1 above: a. Over what intervals does the graph off appear to be rising as x moves from left to right? (for a f(b)) d. Over what intervals does the graph off' appear to be below the x-axis? e. What are the x-coordinates of all of the peaks and valleys of the graph off? f. For what values of x does the graph off' appear to meet the -axis? 3. On the basis of your looking at the graphs of a function and its derivative in #1 and #2, write a statement (or statements) about properties you have observed about the graph of its derivative. a. What do you observe about the graph of the derivative when a function is rising? b. What do you observe about the graph of the derivative when a function is falling? c. What do you obserde about the graph of the derivative when a function has a peak or a valley? | 4. Graph the function spike(x) = 3x2 - 4/+2. Find an appropriate window for fandfprime for spike. a. There are two values of x for which the derivative does not exist. What are these values, and why does the derivative not exist there? b. Find the derivative of fat those values of x where it exists, and add it to the Plot window. c Look at your plot. Does your statement(s) from Problem 3 still hold? Do you need to make any modifications? If so, make your additions or corrections below
Step by Step Solution
There are 3 Steps involved in it

Get step-by-step solutions from verified subject matter experts