

Question: Can someone help me solve this?! Graph 1 Graph 2 lota unts proouced Total units produced Graph 3 Graph 4 j Figure 5-1 Which of
Can someone help me solve this?! 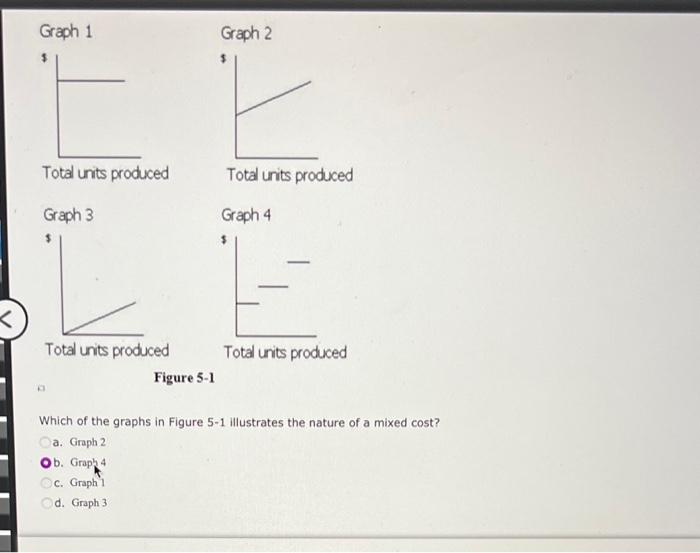
Graph 1 Graph 2 lota unts proouced Total units produced Graph 3 Graph 4 j Figure 5-1 Which of the graphs in Figure 5-1 illustrates the nature of a mixed cost? a. Graph 2 b. Graph 4 c. Graph 1 d. Graph 3
Step by Step Solution
There are 3 Steps involved in it
1 Expert Approved Answer
Step: 1 Unlock

Question Has Been Solved by an Expert!
Get step-by-step solutions from verified subject matter experts
Step: 2 Unlock
Step: 3 Unlock