

Question: Can someone help me solve this problem using this illustration as an example. We use the following graph in the class to illustrate the genetic
Can someone help me solve this problem using this illustration as an example.
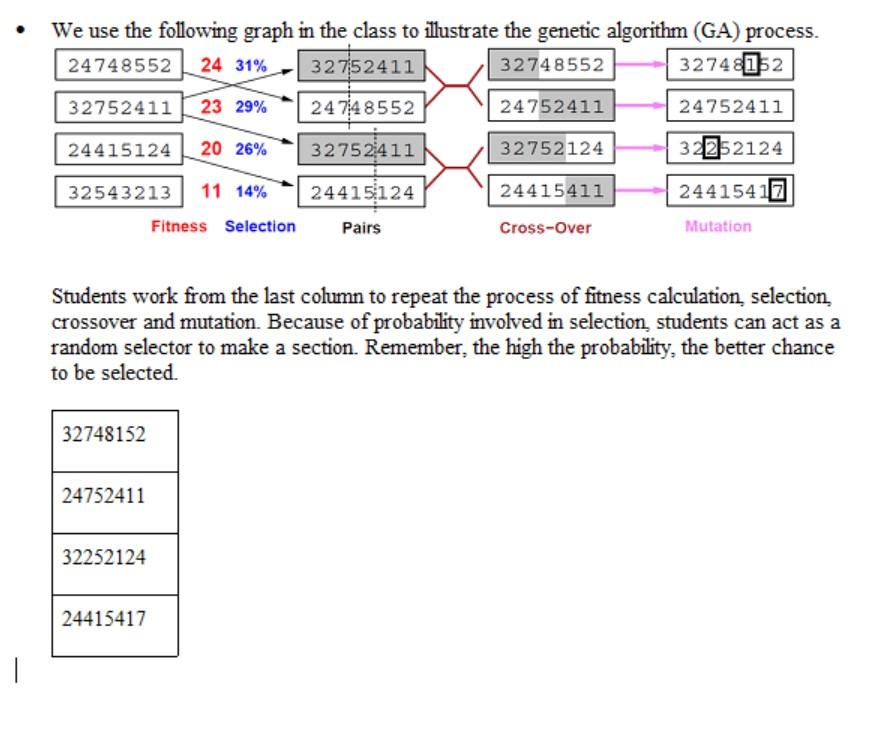
We use the following graph in the class to illustrate the genetic algorithm (GA) process. 24748552 24 31% 32752411 32748552 32748152 32752411 23 29% 24748552 24752411 24752411 24415124 20 26% 32752411 32752124 32252124 24415411 32543213 11 14% Fitness Selection 24415124 Pairs 24415417 Mutation Cross-Over Students work from the last column to repeat the process of fitness calculation, selection crossover and mutation. Because of probability involved in selection students can act as a random selector to make a section. Remember, the high the probability, the better chance to be selected 32748152 24752411 32252124 24415417 We use the following graph in the class to illustrate the genetic algorithm (GA) process. 24748552 24 31% 32752411 32748552 32748152 32752411 23 29% 24748552 24752411 24752411 24415124 20 26% 32752411 32752124 32252124 24415411 32543213 11 14% Fitness Selection 24415124 Pairs 24415417 Mutation Cross-Over Students work from the last column to repeat the process of fitness calculation, selection crossover and mutation. Because of probability involved in selection students can act as a random selector to make a section. Remember, the high the probability, the better chance to be selected 32748152 24752411 32252124 24415417
Step by Step Solution
There are 3 Steps involved in it

Get step-by-step solutions from verified subject matter experts