

Question: Can someone help me solve this question? please show steps and explanation so that I can understand. thank you QUESTION 6 The following stem-and-leaf diagram
Can someone help me solve this question? please show steps and explanation so that I can understand. thank you
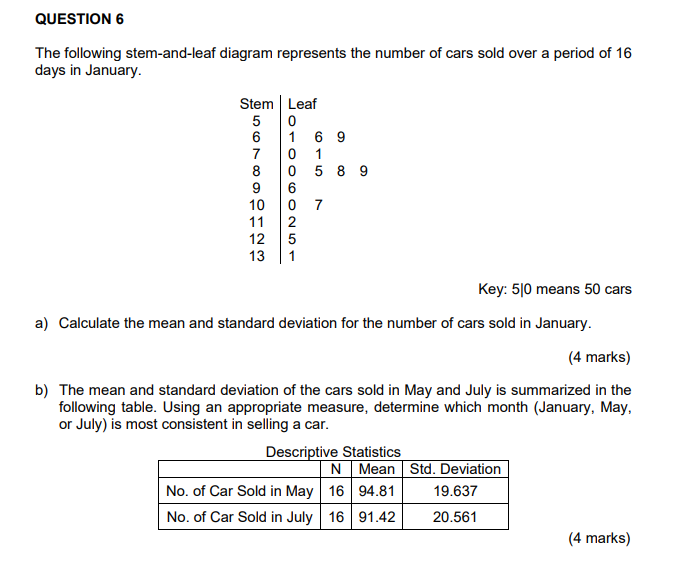
QUESTION 6 The following stem-and-leaf diagram represents the number of cars sold over a period of 16 days in January. Stem Leaf 5 - O 6 9 7 0 8 5 8 9 9 10 7 AUNOOO 11 12 13 Key: 510 means 50 cars a) Calculate the mean and standard deviation for the number of cars sold in January. (4 marks) b) The mean and standard deviation of the cars sold in May and July is summarized in the following table. Using an appropriate measure, determine which month (January, May, or July) is most consistent in selling a car. Descriptive Statistics N Mean Std. Deviation No. of Car Sold in May 16 94.81 19.637 No. of Car Sold in July 16 91.42 20.561 (4 marks)
Step by Step Solution
There are 3 Steps involved in it

Get step-by-step solutions from verified subject matter experts