

Question: Can someone help me to perform a cash flow statement for financial analyses from 2000 to 2005: Below is the exhibit that I got from
Can someone help me to perform a cash flow statement for financial analyses from 2000 to 2005:
Below is the exhibit that I got from the case study:
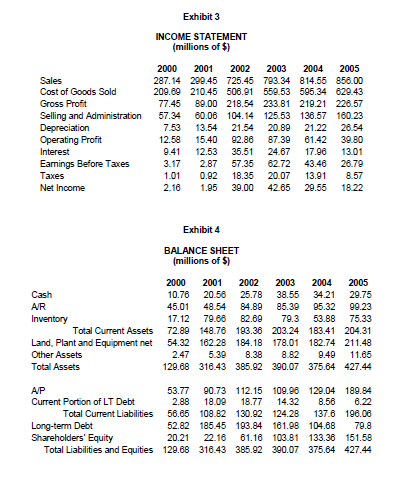
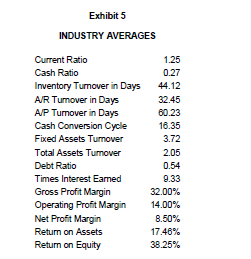
Exhibit 3 INCOME STATEMENT (millions of $) Sales Cost of Goods Sold Gross Profit Selling and Administration Depreciation Operating Profit Interest Earnings Before Taxes Taxes Net Income 2000 2001 2002 2003 2004 2005 287.14 299.45 725.45 793.34 814.55 856.00 209.69 210.45 506.91 550.53 595.34 629.43 77.45 89.00 218.54 233.81 219.21 226.57 57.34 60.06 104.14 125.53 136.57 160.23 7.53 13.54 21.54 20.89 21.22 26.54 12.58 15.40 92.86 87.39 61.42 39.80 9.41 12.53 35.51 24.67 17.96 13.01 3.17 2.87 57.35 62.72 43.48 26.79 1.01 0.92 18.35 20.07 13.91 8.57 2.16 1.95 39.00 42.65 29.55 18.22 Exhibit 4 BALANCE SHEET (millions of $) Cash AR Inventory Total Current Assets Land, Plant and Equipment net Other Assets Total Assets 2000 2001 2002 2003 2004 2005 10.76 20.58 25.78 38.55 34.21 29.75 45.01 48.54 84.89 85.39 95.32 99.23 17.12 79.68 82.69 79.3 53.88 75.33 72.89 148.76 193.36 203.24 183.41 204.31 54.32 162 28 184.18 178.01 182.74 211.48 2.47 8.38 8.82 9.49 11.65 129.68 316.43 385.92 390.07 375.84 427.44 5.39 AP 53.77 90.73 112.15 109.98 129.04 189.84 Current Portion of LT Debt 2.88 18.09 18.77 14.32 8.56 6.22 Total Current Liabilities 56.65 108.82 130.92 124.28 137.6 190.00 Long-term Debt 52.82 185.45 193.84 161.98 104.88 79.8 Shareholders' Equity 20.21 22.16 61.16 103.81 133.36 151.58 Total Liabilities and Equities 129.68 316.43 385.92 390.07 375.64 427.44 Exhibit 5 INDUSTRY AVERAGES Current Ratio Cash Ratio Inventory Turnover in Days A/R Turnover in Days AJP Turnover in Days Cash Conversion Cycle Fixed Assets Tumover Total Assets Tumover Debt Ratio Times Interest Earned Gross Profit Margin Operating Profit Margin Net Profit Margin Return on Assets Return on Equity 1.25 0.27 44.12 32.45 60.23 16.35 3.72 2.05 0.54 9.33 32.00% 14.00% 8.50% 17.46% 38.25%
Step by Step Solution
There are 3 Steps involved in it

Get step-by-step solutions from verified subject matter experts