

Question: Can someone help me using R? Consider the following data: X 3.04 4.55 7.47 6.33 5.00 5.20 9.66 11.11 8.34 7.10 y 10.48 1.76 -19.38
Can someone help me using R?
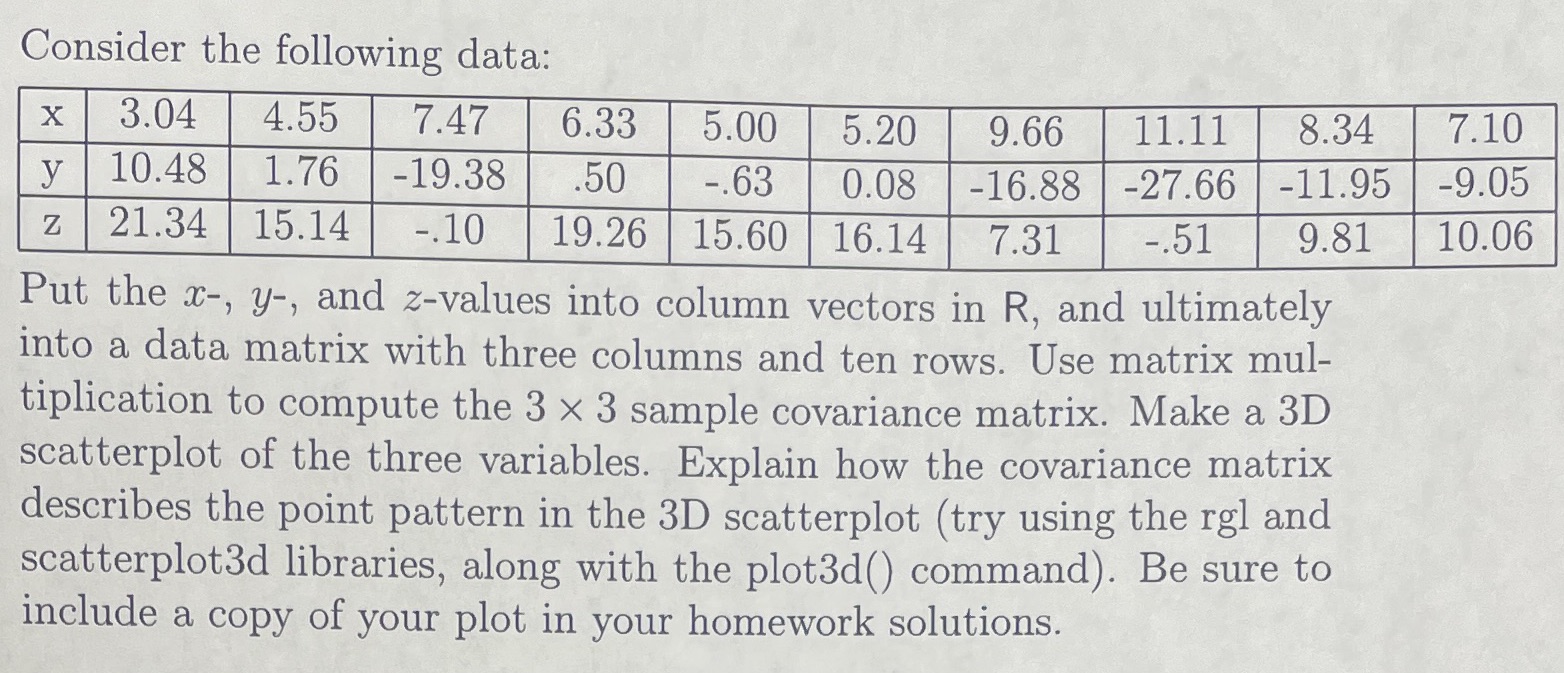
Consider the following data: X 3.04 4.55 7.47 6.33 5.00 5.20 9.66 11.11 8.34 7.10 y 10.48 1.76 -19.38 .50 -.63 0.08 -16.88 -27.66 11.95 -9.05 Z 21.34 15.14 -.10 19.26 15.60 16.14 7.31 -.51 9.81 10.06 Put the x-, y-, and z-values into column vectors in R, and ultimately into a data matrix with three columns and ten rows. Use matrix mul- tiplication to compute the 3 x 3 sample covariance matrix. Make a 3D scatterplot of the three variables. Explain how the covariance matrix describes the point pattern in the 3D scatterplot (try using the rel and scatterplot3d libraries, along with the plot3d() command). Be sure to include a copy of your plot in your homework solutions
Step by Step Solution
There are 3 Steps involved in it

Get step-by-step solutions from verified subject matter experts