

Question: Can someone help me with these please I keep getting it wrong :( The graph below depicts the demand curve facing a monopolist. The monopoly
Can someone help me with these please I keep getting it wrong :(
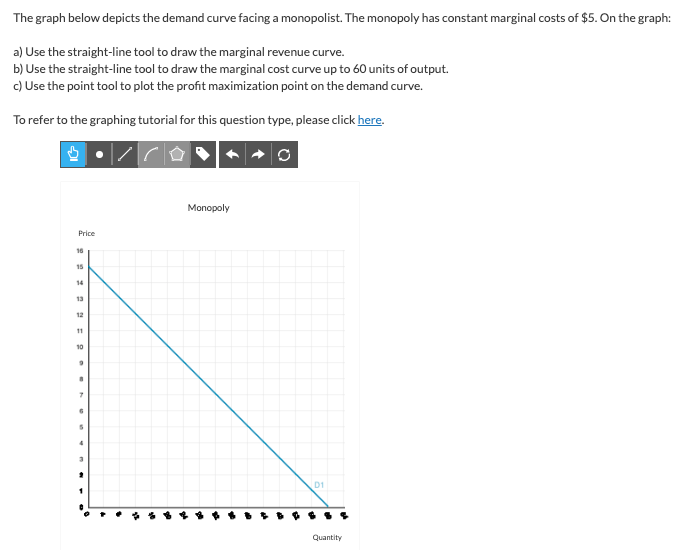
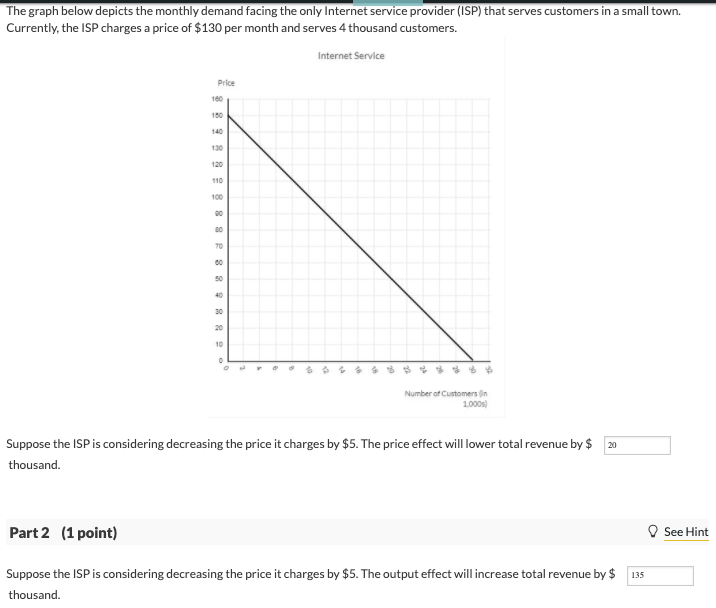
The graph below depicts the demand curve facing a monopolist. The monopoly has constant marginal costs of $5. On the graph: a) Use the straight-line tool to draw the marginal revenue curve. b) Use the straight-line tool to draw the marginal cost curve up to 60 units of output. c) Use the point tool to plot the profit maximization point on the demand curve. To refer to the graphing tutorial for this question type, please click here. Monopoly Price 16 13 D1 QuantityThe graph below depicts the monthly demand facing the only Internet service provider (ISP) that serves customers in a small town. Currently, the ISP charges a price of $130 per month and serves 4 thousand customers. Internet Service Price 180 150 140 1:30 120 110 Number of Customers In 1.000s) Suppose the ISP is considering decreasing the price it charges by $5. The price effect will lower total revenue by $ 20 thousand. Part 2 (1 point) See Hint Suppose the ISP is considering decreasing the price it charges by $5. The output effect will increase total revenue by $ 135 thousand
Step by Step Solution
There are 3 Steps involved in it

Get step-by-step solutions from verified subject matter experts