

Question: can someone help me with this case study for reimbursement MILWAUKEE REGIONAL HEALTH SYSTEM REVENUE CYCLE MANAGEMENT ANDREW MAE HAS recently been hired as the
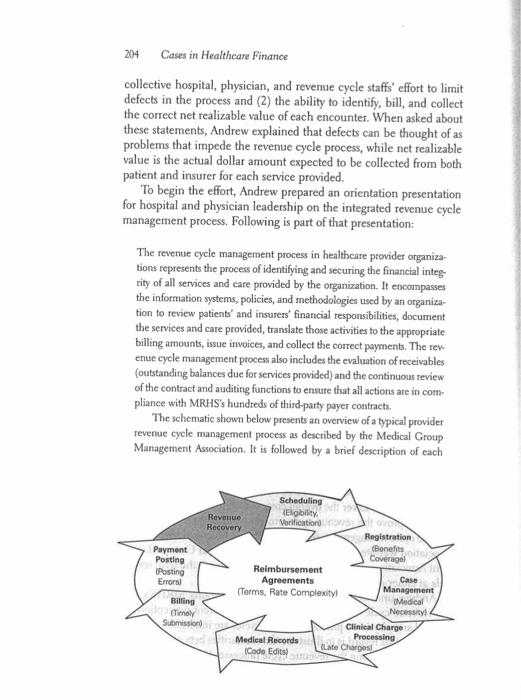
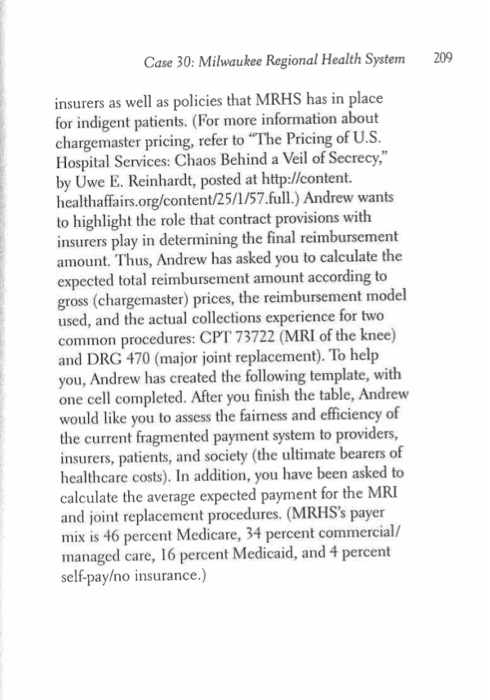
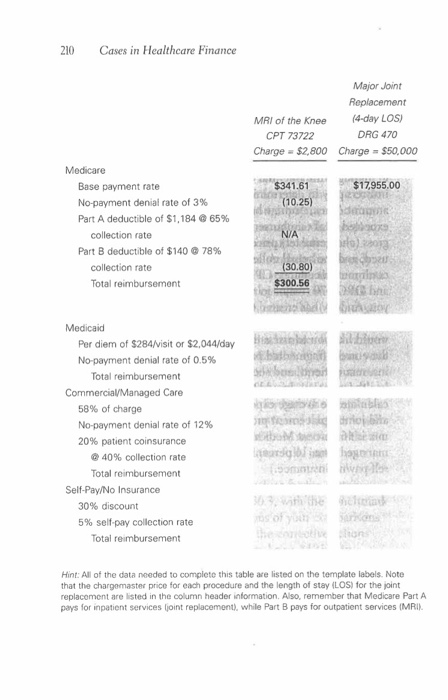
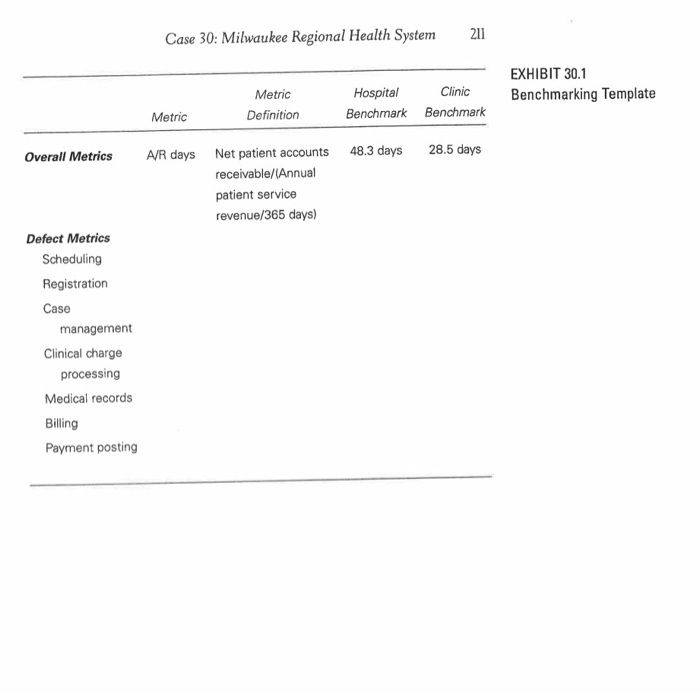
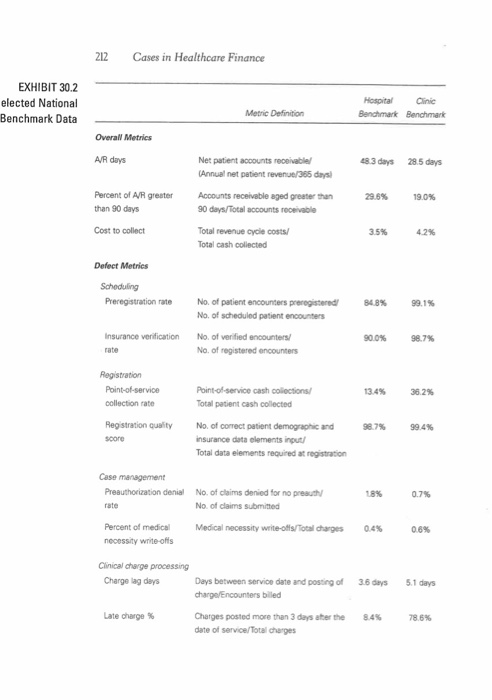
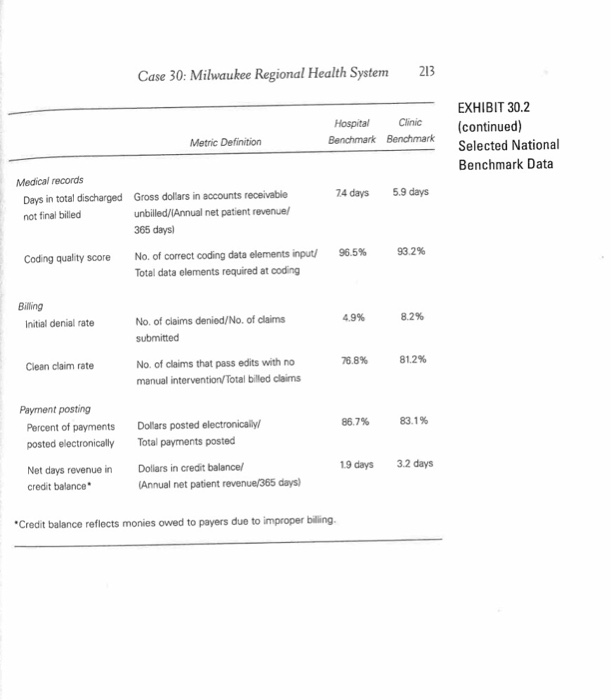
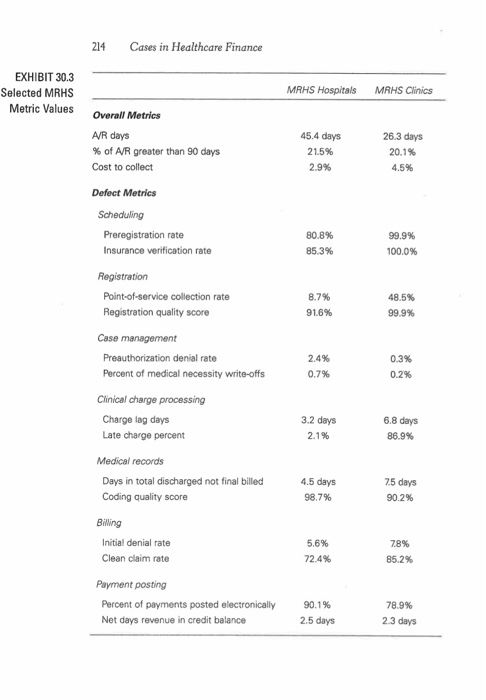
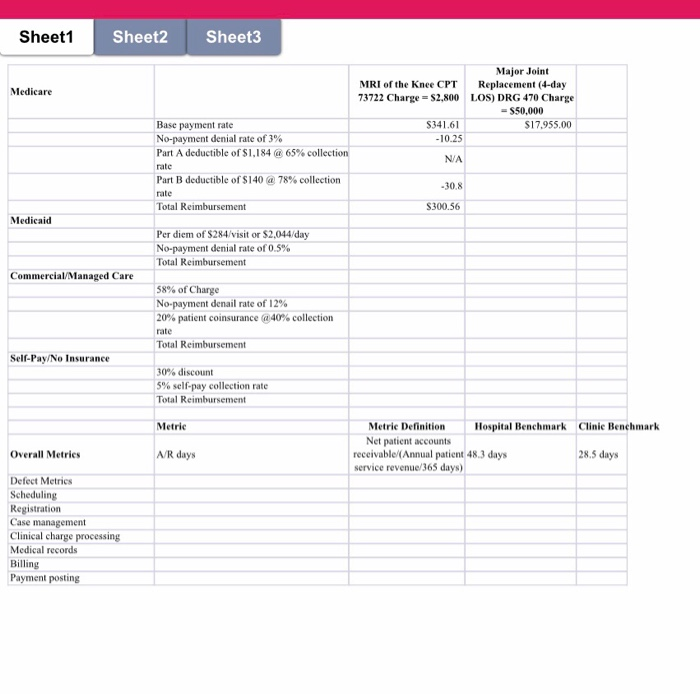
MILWAUKEE REGIONAL HEALTH SYSTEM REVENUE CYCLE MANAGEMENT ANDREW MAE HAS recently been hired as the vice president of Revenue Cycle Management for the Milwaukee Regional Health Sys- tem (MRHS), an integrated system with approximately $2.5 billion in annual revenues. Located in the Milwaukee metropolitan area, MRHS consists of an academic medical center, two community hospitals, and 30 outpatient primary and specialty care clinics. Annually, the hospitals collectively see more than 40,000 admissions, approximately 100,000 emergency room visits, and nearly 1 million outpatient encounters, while the clinics receive more than 1.6 million visits. The vice president of Revenue Cycle Management is a newly cre- ated position at MRHS. In that role, Andrew will oversee the merger of the currently separate hospital and physician revenue cycle depart- ments. Andrew has been directed by MRHS's CEO to accomplish two primary goals: (1) lower the overall costs of revenue cycle management and (2) improve the revenue cycle process. (For more information on revenue cycle management, see the Healthcare Financial Management Association website at www.hfma.org or the Medical Group Manage- ment Association website at www.mgma.com. Search the term revenue cycle at either or both websites.) Andrew understands that the first step in merging MRHS's sepa- rate revenue cycle departments is to alter the current perception that hospital and physician practice revenue cycles are inherently different His goal in this regard is to illustrate the similarities between and inter- among the revenue cycle processes to highlight what he believes to be the true determinants of revenue cycle success: (1) the dependencies 204 Cases in Healthcare Finance collective hospital, physician, and revenue cycle staffs' effort to limit defects in the process and (2) the ability to identify, bill, and collect the correct net realizable value of each encounter. When asked about these statements, Andrew explained that defects can be thought of as problems that impede the revenue cycle process, while net realizabl value is the actual dollar amount expected to be collected from both patient and insurer for each service provided. To begin the effort, Andrew prepared an orientation presentation for hospital and physician leadership on the integrated revenue cycle management process. Following is part of that presentation: The revenue cycle management process in healthcare provider organiza- tions represents the process of identifying and securing the financial integ- ri ty of all services and care provided by the organization. It encompasses the information systems, policies, and methodologies used by an organiza- tion to review patients' and insurers' financial responsibilities, document the services and care provided, translate those activities to the appropriate billing amounts, issue invoices, and collect the correct payments. The rev enue cycle management process also includes the evaluation of receivables (outstanding balances due for services provided) and the continuous review of the contract and auditing functions to ensure that all actions are in com- pliance with MRHS's hundreds of third-party payer contracts. The schematic shown below presents an overview of a typical provider revenue cycle management process as described by the Medical Group Management Association. It is followed by a brief description of each Revenue Recovery Benefits ois Payment Posting Posting Errors) Case Terms, Rate Complexity Necessityl Clinical Charge Medical Records Code Edits) Late Cases in Healthcare Finance 206 Clinical charge processing. Here, the clinical documentation of services provided is translated to line-item charges. Clinical charge processing, which applies to hospital and clinic services, uses diagnosis-related group (DRG) and revenue codes for hospital billing and Current Procedural Terminology (CPT) and Healthcare Common Procedure Coding System codes for outpatient and physician billing. .Documentation of all services and the level of care provided is matched to the charge description master (chargemaster) file. Examples of potential defects during the execution of this function include charges submitted after the allowed documentation period (late charges) and improper matching of clinical entries with the chargemaster file. Medical records. This function consists of the systematic compilation and documentation of all care provided to patients during and, if appropriate, subsequent to the encounter. A single patient record for all services is created. Information in the record is available to patients and other care pro- viders, subject to certain regulations and restrictions. Examples of potential defects during the execution of this function include documentation and coding errors and lag times in the coding and compiling of the record (discharged but not billed). . Billing. This function converts the information gathered in previous func- tions to patient and insurer bills (invoices). In the billing function, UB04 forms (for hospital inpatient and out- patient insurance billing) and CMS 1500 forms (for physician insur- ance billing) are prepared. Given the highly technical nature of the UB04 and CMS 1500 forms, separate billing statements are created for patients that indicate their payment responsibilities. .Examples of potential defects during the execution of this function include a lack of timely bill submission and failure to follow the spe- cific billing rules required by the insurer, which results in payment denials Payment posting. In this function, the accounts receivable entry is adjusted as invoices are collected. Note that this process may require a coordinated effort of follow-up and collections actions directed at the insurer and/or patient. Case 30: Milwaukee Regional Health System 207 Payment posting is complicated by the many different rules, regula- tions, and data formats required by private and government insurers Unpaid balances due from patients undergo another round of pro- cessing, including research to find additional insurance and/or finan- cial status information. include mishandling of insurer payment denials, posting errors that confusion over insurer invoicing and coverage. .Examples of potential defects during the execution of this function misstate the remaining outstanding balance from patients, and patients Revenue recovery. This audit function takes place continuously to examine the entire revenue cycle process. The following steps are taken during revenue recovery Measure the performance of each revenue cycle function according to established benchmarks Identify the cause of each defect and take corrective action as neces- sary. .Ensure compliance with regulatory requirements and confirm that payments received are consistent with all insurer contract provisions and the organization's charity care policy. .Defects that can occur in this function include improper selection of benchmark metrics and/or values and failure to aggressively audit and/ or correct defects in the revenue cycle The hospital and physician leaders found Andrew's presentation to be a valuable overview of the revenue cycle process. However, they remained concerned over the merging of the two revenue cycle depart- ments and questioned the metrics chosen to monitor performance. In addition, they expressed a need to know more about the concept of defects and how to identify and correct them. Finally, the leaders wanted to learn more about net realizable value, specifically, the dif- ferences across the most important insurer contracts. To address these issues, Andrew began to create two documents: one that includes both hospital and clinic revenue cycle performance metrics and another that highlights the differences in reimbursement methodologies and net realizable values. Note that all metric and reimbursement values provided in this case are for instructional use only and should not be used for other purposes. The next meeting with hospital and physician leadership is sched- uled in two weeks, and Andrew had planned to complete the two 208 Cases in Healthcare Finance projects prior to the meeting Unfortunately, Andrew broke his leg in a snowmobile accident and requires surgery and a short hospitalization, so he is unable to get the work done in time for the meeting. Thus, he has asked you, an administrative fellow at MRHS, to help out. He has given you the following three tasks: 1. Establish two overall revenue cycle performance metrics and one defect metric for each revenue cycle function, from scheduling through payment posting The metrics should be based on nationally accepted practices, and the list should include definitions and current benchmark values. Andrew has already started this task, so he provided you with the template shown in Exhibit 30.1, which contains one overall performance metric, accounts receivable (A/R) days, already filled in. Also, he finished compiling a list of metric candidates and benchmark values from various sources, which is provided in Exhibit 30.2. Thus, your task is to choose one additional overall performance metric and the single best defect metric for each function listed in Exhibit 30.1 for both the hospital and clinic settings. Andrew mentioned that there will be a great deal of discussion of these metrics at the meeting, so it is essential that you fully justify your selections. Compare the MRHS actual values for the metrics 2. values. Discuss the implications of your comparisons and, most important, suggest the corrective actions that should be implemented to bring MRHS in line with national standards for the areas of subpar 3. Every year, MRHS performs an extensive pricing study comparing its gross charges (chargemaster prices) to other healthcare providers in its market in order to competitively align its price structure. Of course, MRHS typically gets paid far less than gross charges for the care it provides. The actual billing amount is determined by analyzing the hundreds of reimbursement contracts the system has in force with Case 30: Milwaukee Regional Health System 209 insurers as well as policies that MRHS has in place for indigent patients. (For more information about chargemaster pricing, refer to "The Pricing of U.S Hospital Services: Chaos Behind a Veil of Secrecy," by Uwe E. Reinhardt, posted at http://content. healthaffairs.org/content/25/1/57.full.) Andrew wants to highlight the role that contract provisions with insurers play in determining the final reimbursement amount. Thus, Andrew has asked you to calculate the expected total reimbursement amount according to gross (chargemaster) prices, the reimbursement model used, and the actual collections experience for two common procedures: CPT 73722 (MRI of the knee) and DRG 470 (major joint replacement). To help you, Andrew has created the following template, with one cell completed. After you finish the table, Andrew would like you to assess the fairness and efficiency of urrent fragmented payment system to providers, insurers, patients, and society (the ultimate bearers of healthcare costs). In addition, you have been asked to calculate the average expected payment for the MRI and joint replacement procedures. (MRHS's payer mix is 46 percent Medicare, 34 percent commercial/ managed care, 16 percent Medicaid, and 4 percent self-payo insurance.) 210 Cases in Healthcare Finance Major Joint Replacement (4-day LOs) DRG 470 MRI of the Knee CPT 73722 Charge $2,800 Charge $50,000 Medicare $341.61$17,955,00 Base payment rate No-payment denial rate of 3% Part A deductible of $1.184 @ 65% (10.25) collection rate Part B deductible of $140 @ 78% sa (30.80) $300.56 collection rate Total reimbursement Medicaid Per diem of $284/visit or $2,044/day No-payment denial rate of 0.5% Chathh Total reimbursement Commercial/Managed Care 58% of charge No-payment denial rate of 12% 20% patient coinsurance feindldq driioidih Top @ 40% collection rate Total reimbursement Somen Self-Pay/No Insurance 30% discount 5% self-pay collection rate oteon Total reimbursement Hint: All of the data needed to complete this table are listed on the template labels. Note that the chargomaster price for each procedure and the length of stay ILOS) for the joint replacoment are listed in the column header information. Also, remember that Medicare Part A pays for inpatient services ljoint replacement), while Part B pays for outpatient services (MRI Case 30: Milwaukee Regional Health System 21 EXHIBIT 30.1 HospitalClnicBenchmarking Template Benchmark Benchmark Metric Definition Metric Il Metrics A/R days Net patient accounts 48.3 days 28.5 days receivable/(Annual patient service revenue/365 days) Defect Metrics Scheduling Registration Case management Clinical charge processing Medical records Billing Payment posting 212 Cases in Healthcare Finance EXHIBIT 30.2 elected National Benchmark Data Hospital Clinic Benchmark Benchmark Metric Definition Overall Metrics A/R days Net patient accounts receivable Annual net patient revenue/365 daysl 48 3 days 28.5 days Percent of A/R greater than 90 days Accounts receiveble aged greater than 90 days/Total accounts receivable 29,6% 19.0% Cost to colect Total revenue cycle costs Total cash collected 3.5% 42% Defect Metrics Preregistration rate No. of patient encounters preregstered No. of scheduled patient encounters 84.8% 99.1% Insurance venification rate No of verified encounters/ No. of registered encounters 90.0% 98.7% t3.4% 96.2% collection rate otal patient cash collected Registration qualityNo. of correct patient demographic and 987% 994% soore nsurance deta elements input Total data elements required at registration Case management Preauthorization denial No. of claims denied for no preauth No of claims submited Medical necessity write-offs/Total darges 18% 0.7% rate Percent of medical necessity wnite-ofis 0.4% 0 6% Clinical charge processing Charge lag days Days between service date and posting of 36 days 5.1 days Late charge % Charges posted more than 3 days ater the date of service/Total charges 84% 78.6% 213 Case 30: Milwaukee Regional Health System EXHIBIT 30.2 Hospital Clinic Benchmark Bencontinued) Metric Definition Selected National Benchmark Data Medical records 5.9 days Gross dollars in accounts receivable unbilled/lAnnual net patient revenue 365 days 74 days Days in total discharged not final billed 93.2% No. of correct coding data elements iput/ Total data elements required at coding 96.5% Coding quality score Billing 8.2% No. of ciaims denied/No. of claims submitted 4.9% Initial denial rate 76.8% 81.2% No. of claims that pass edits with no manual intervention/Total billed claims Clean claim rate Payment posting 83.1% Percent of payments Dollars posted electronicaly/ posted electronically Total payments posted 86.7% 19 days 32 days Net days revenue in Dollars in credit balance/ credit balance Annual net patient revenue/365 days) Credit balance reflects monies owed to payers due to improper billing. 214 Cases in Healthcare Finance EXHIBIT 30.3 Selected MRHS Metric Value MRHS Hospitals MRHS Clinics Overall Metrics A/R days % of AR greater than 90 days Cost to collect 45.4 days 21.5% 2.9% 26.3 days 20.1% 4.5% Defect Metrics Preregistration rate Insurance verification rate 80.8% 85.3% 99.9% 100.0% Point-of-service collection rate 8.7% 91.6% 48.5% 99.9% Registration quality score Case management 2.4% 0.7% Preauthorization denial rate 0.3% Percent of medical necessity write-offs 0.2% Clinical charge processing Charge lag days Late charge percent 3.2 days 21% 6.8 days Medical records Days in total discharged not final billed Coding quality score 4.5 days 98.7% 75 days 90.2% Initial denial rate 5.6% 72.4% Clean claim rate 85.2% Payment posting Percent of payments posted electronically Net days revenue in credit balance 90.1% 2.5 days 78.9% 2.3 days Sheet1 Sheet2 Sheet3 Major Joint MRI of the Knee CPT Replacement (4-day 73722 Charge S2,800 LOS) DRG 470 Charge Medicare -$50,000 $341.61 10.25 N/A $17955.00 Base payment rate No-payment denial rate of 3% Part A deductible of $1.184 @ 65% collection rate Part B deductible of $140 @ 78% collection rate 30.8 S300.56 Medicaid Per diem of $284/visit or $2,044/day No-payment denial rate of 0.5% Total Reimbursement Commercial/Managed Care 58% of Charge No-payment derail rate of 12% 20% patient coinsurance @40% collection rate Self-Pay/No Insurance 30% discount 5% self-pay collection rate Total Reimbursement Metric Metric DefinitionHospital Benchmark Clinic Benchmark Net patient accounts Overall Metrics /R days 28.5 days receivable(Annual patient 48.3 days service revenue/365 days) Defect Metrics Scheduling Registration Case management Clinical charge processing Medical records Billing Payment posting MILWAUKEE REGIONAL HEALTH SYSTEM REVENUE CYCLE MANAGEMENT ANDREW MAE HAS recently been hired as the vice president of Revenue Cycle Management for the Milwaukee Regional Health Sys- tem (MRHS), an integrated system with approximately $2.5 billion in annual revenues. Located in the Milwaukee metropolitan area, MRHS consists of an academic medical center, two community hospitals, and 30 outpatient primary and specialty care clinics. Annually, the hospitals collectively see more than 40,000 admissions, approximately 100,000 emergency room visits, and nearly 1 million outpatient encounters, while the clinics receive more than 1.6 million visits. The vice president of Revenue Cycle Management is a newly cre- ated position at MRHS. In that role, Andrew will oversee the merger of the currently separate hospital and physician revenue cycle depart- ments. Andrew has been directed by MRHS's CEO to accomplish two primary goals: (1) lower the overall costs of revenue cycle management and (2) improve the revenue cycle process. (For more information on revenue cycle management, see the Healthcare Financial Management Association website at www.hfma.org or the Medical Group Manage- ment Association website at www.mgma.com. Search the term revenue cycle at either or both websites.) Andrew understands that the first step in merging MRHS's sepa- rate revenue cycle departments is to alter the current perception that hospital and physician practice revenue cycles are inherently different His goal in this regard is to illustrate the similarities between and inter- among the revenue cycle processes to highlight what he believes to be the true determinants of revenue cycle success: (1) the dependencies 204 Cases in Healthcare Finance collective hospital, physician, and revenue cycle staffs' effort to limit defects in the process and (2) the ability to identify, bill, and collect the correct net realizable value of each encounter. When asked about these statements, Andrew explained that defects can be thought of as problems that impede the revenue cycle process, while net realizabl value is the actual dollar amount expected to be collected from both patient and insurer for each service provided. To begin the effort, Andrew prepared an orientation presentation for hospital and physician leadership on the integrated revenue cycle management process. Following is part of that presentation: The revenue cycle management process in healthcare provider organiza- tions represents the process of identifying and securing the financial integ- ri ty of all services and care provided by the organization. It encompasses the information systems, policies, and methodologies used by an organiza- tion to review patients' and insurers' financial responsibilities, document the services and care provided, translate those activities to the appropriate billing amounts, issue invoices, and collect the correct payments. The rev enue cycle management process also includes the evaluation of receivables (outstanding balances due for services provided) and the continuous review of the contract and auditing functions to ensure that all actions are in com- pliance with MRHS's hundreds of third-party payer contracts. The schematic shown below presents an overview of a typical provider revenue cycle management process as described by the Medical Group Management Association. It is followed by a brief description of each Revenue Recovery Benefits ois Payment Posting Posting Errors) Case Terms, Rate Complexity Necessityl Clinical Charge Medical Records Code Edits) Late Cases in Healthcare Finance 206 Clinical charge processing. Here, the clinical documentation of services provided is translated to line-item charges. Clinical charge processing, which applies to hospital and clinic services, uses diagnosis-related group (DRG) and revenue codes for hospital billing and Current Procedural Terminology (CPT) and Healthcare Common Procedure Coding System codes for outpatient and physician billing. .Documentation of all services and the level of care provided is matched to the charge description master (chargemaster) file. Examples of potential defects during the execution of this function include charges submitted after the allowed documentation period (late charges) and improper matching of clinical entries with the chargemaster file. Medical records. This function consists of the systematic compilation and documentation of all care provided to patients during and, if appropriate, subsequent to the encounter. A single patient record for all services is created. Information in the record is available to patients and other care pro- viders, subject to certain regulations and restrictions. Examples of potential defects during the execution of this function include documentation and coding errors and lag times in the coding and compiling of the record (discharged but not billed). . Billing. This function converts the information gathered in previous func- tions to patient and insurer bills (invoices). In the billing function, UB04 forms (for hospital inpatient and out- patient insurance billing) and CMS 1500 forms (for physician insur- ance billing) are prepared. Given the highly technical nature of the UB04 and CMS 1500 forms, separate billing statements are created for patients that indicate their payment responsibilities. .Examples of potential defects during the execution of this function include a lack of timely bill submission and failure to follow the spe- cific billing rules required by the insurer, which results in payment denials Payment posting. In this function, the accounts receivable entry is adjusted as invoices are collected. Note that this process may require a coordinated effort of follow-up and collections actions directed at the insurer and/or patient. Case 30: Milwaukee Regional Health System 207 Payment posting is complicated by the many different rules, regula- tions, and data formats required by private and government insurers Unpaid balances due from patients undergo another round of pro- cessing, including research to find additional insurance and/or finan- cial status information. include mishandling of insurer payment denials, posting errors that confusion over insurer invoicing and coverage. .Examples of potential defects during the execution of this function misstate the remaining outstanding balance from patients, and patients Revenue recovery. This audit function takes place continuously to examine the entire revenue cycle process. The following steps are taken during revenue recovery Measure the performance of each revenue cycle function according to established benchmarks Identify the cause of each defect and take corrective action as neces- sary. .Ensure compliance with regulatory requirements and confirm that payments received are consistent with all insurer contract provisions and the organization's charity care policy. .Defects that can occur in this function include improper selection of benchmark metrics and/or values and failure to aggressively audit and/ or correct defects in the revenue cycle The hospital and physician leaders found Andrew's presentation to be a valuable overview of the revenue cycle process. However, they remained concerned over the merging of the two revenue cycle depart- ments and questioned the metrics chosen to monitor performance. In addition, they expressed a need to know more about the concept of defects and how to identify and correct them. Finally, the leaders wanted to learn more about net realizable value, specifically, the dif- ferences across the most important insurer contracts. To address these issues, Andrew began to create two documents: one that includes both hospital and clinic revenue cycle performance metrics and another that highlights the differences in reimbursement methodologies and net realizable values. Note that all metric and reimbursement values provided in this case are for instructional use only and should not be used for other purposes. The next meeting with hospital and physician leadership is sched- uled in two weeks, and Andrew had planned to complete the two 208 Cases in Healthcare Finance projects prior to the meeting Unfortunately, Andrew broke his leg in a snowmobile accident and requires surgery and a short hospitalization, so he is unable to get the work done in time for the meeting. Thus, he has asked you, an administrative fellow at MRHS, to help out. He has given you the following three tasks: 1. Establish two overall revenue cycle performance metrics and one defect metric for each revenue cycle function, from scheduling through payment posting The metrics should be based on nationally accepted practices, and the list should include definitions and current benchmark values. Andrew has already started this task, so he provided you with the template shown in Exhibit 30.1, which contains one overall performance metric, accounts receivable (A/R) days, already filled in. Also, he finished compiling a list of metric candidates and benchmark values from various sources, which is provided in Exhibit 30.2. Thus, your task is to choose one additional overall performance metric and the single best defect metric for each function listed in Exhibit 30.1 for both the hospital and clinic settings. Andrew mentioned that there will be a great deal of discussion of these metrics at the meeting, so it is essential that you fully justify your selections. Compare the MRHS actual values for the metrics 2. values. Discuss the implications of your comparisons and, most important, suggest the corrective actions that should be implemented to bring MRHS in line with national standards for the areas of subpar 3. Every year, MRHS performs an extensive pricing study comparing its gross charges (chargemaster prices) to other healthcare providers in its market in order to competitively align its price structure. Of course, MRHS typically gets paid far less than gross charges for the care it provides. The actual billing amount is determined by analyzing the hundreds of reimbursement contracts the system has in force with Case 30: Milwaukee Regional Health System 209 insurers as well as policies that MRHS has in place for indigent patients. (For more information about chargemaster pricing, refer to "The Pricing of U.S Hospital Services: Chaos Behind a Veil of Secrecy," by Uwe E. Reinhardt, posted at http://content. healthaffairs.org/content/25/1/57.full.) Andrew wants to highlight the role that contract provisions with insurers play in determining the final reimbursement amount. Thus, Andrew has asked you to calculate the expected total reimbursement amount according to gross (chargemaster) prices, the reimbursement model used, and the actual collections experience for two common procedures: CPT 73722 (MRI of the knee) and DRG 470 (major joint replacement). To help you, Andrew has created the following template, with one cell completed. After you finish the table, Andrew would like you to assess the fairness and efficiency of urrent fragmented payment system to providers, insurers, patients, and society (the ultimate bearers of healthcare costs). In addition, you have been asked to calculate the average expected payment for the MRI and joint replacement procedures. (MRHS's payer mix is 46 percent Medicare, 34 percent commercial/ managed care, 16 percent Medicaid, and 4 percent self-payo insurance.) 210 Cases in Healthcare Finance Major Joint Replacement (4-day LOs) DRG 470 MRI of the Knee CPT 73722 Charge $2,800 Charge $50,000 Medicare $341.61$17,955,00 Base payment rate No-payment denial rate of 3% Part A deductible of $1.184 @ 65% (10.25) collection rate Part B deductible of $140 @ 78% sa (30.80) $300.56 collection rate Total reimbursement Medicaid Per diem of $284/visit or $2,044/day No-payment denial rate of 0.5% Chathh Total reimbursement Commercial/Managed Care 58% of charge No-payment denial rate of 12% 20% patient coinsurance feindldq driioidih Top @ 40% collection rate Total reimbursement Somen Self-Pay/No Insurance 30% discount 5% self-pay collection rate oteon Total reimbursement Hint: All of the data needed to complete this table are listed on the template labels. Note that the chargomaster price for each procedure and the length of stay ILOS) for the joint replacoment are listed in the column header information. Also, remember that Medicare Part A pays for inpatient services ljoint replacement), while Part B pays for outpatient services (MRI Case 30: Milwaukee Regional Health System 21 EXHIBIT 30.1 HospitalClnicBenchmarking Template Benchmark Benchmark Metric Definition Metric Il Metrics A/R days Net patient accounts 48.3 days 28.5 days receivable/(Annual patient service revenue/365 days) Defect Metrics Scheduling Registration Case management Clinical charge processing Medical records Billing Payment posting 212 Cases in Healthcare Finance EXHIBIT 30.2 elected National Benchmark Data Hospital Clinic Benchmark Benchmark Metric Definition Overall Metrics A/R days Net patient accounts receivable Annual net patient revenue/365 daysl 48 3 days 28.5 days Percent of A/R greater than 90 days Accounts receiveble aged greater than 90 days/Total accounts receivable 29,6% 19.0% Cost to colect Total revenue cycle costs Total cash collected 3.5% 42% Defect Metrics Preregistration rate No. of patient encounters preregstered No. of scheduled patient encounters 84.8% 99.1% Insurance venification rate No of verified encounters/ No. of registered encounters 90.0% 98.7% t3.4% 96.2% collection rate otal patient cash collected Registration qualityNo. of correct patient demographic and 987% 994% soore nsurance deta elements input Total data elements required at registration Case management Preauthorization denial No. of claims denied for no preauth No of claims submited Medical necessity write-offs/Total darges 18% 0.7% rate Percent of medical necessity wnite-ofis 0.4% 0 6% Clinical charge processing Charge lag days Days between service date and posting of 36 days 5.1 days Late charge % Charges posted more than 3 days ater the date of service/Total charges 84% 78.6% 213 Case 30: Milwaukee Regional Health System EXHIBIT 30.2 Hospital Clinic Benchmark Bencontinued) Metric Definition Selected National Benchmark Data Medical records 5.9 days Gross dollars in accounts receivable unbilled/lAnnual net patient revenue 365 days 74 days Days in total discharged not final billed 93.2% No. of correct coding data elements iput/ Total data elements required at coding 96.5% Coding quality score Billing 8.2% No. of ciaims denied/No. of claims submitted 4.9% Initial denial rate 76.8% 81.2% No. of claims that pass edits with no manual intervention/Total billed claims Clean claim rate Payment posting 83.1% Percent of payments Dollars posted electronicaly/ posted electronically Total payments posted 86.7% 19 days 32 days Net days revenue in Dollars in credit balance/ credit balance Annual net patient revenue/365 days) Credit balance reflects monies owed to payers due to improper billing. 214 Cases in Healthcare Finance EXHIBIT 30.3 Selected MRHS Metric Value MRHS Hospitals MRHS Clinics Overall Metrics A/R days % of AR greater than 90 days Cost to collect 45.4 days 21.5% 2.9% 26.3 days 20.1% 4.5% Defect Metrics Preregistration rate Insurance verification rate 80.8% 85.3% 99.9% 100.0% Point-of-service collection rate 8.7% 91.6% 48.5% 99.9% Registration quality score Case management 2.4% 0.7% Preauthorization denial rate 0.3% Percent of medical necessity write-offs 0.2% Clinical charge processing Charge lag days Late charge percent 3.2 days 21% 6.8 days Medical records Days in total discharged not final billed Coding quality score 4.5 days 98.7% 75 days 90.2% Initial denial rate 5.6% 72.4% Clean claim rate 85.2% Payment posting Percent of payments posted electronically Net days revenue in credit balance 90.1% 2.5 days 78.9% 2.3 days Sheet1 Sheet2 Sheet3 Major Joint MRI of the Knee CPT Replacement (4-day 73722 Charge S2,800 LOS) DRG 470 Charge Medicare -$50,000 $341.61 10.25 N/A $17955.00 Base payment rate No-payment denial rate of 3% Part A deductible of $1.184 @ 65% collection rate Part B deductible of $140 @ 78% collection rate 30.8 S300.56 Medicaid Per diem of $284/visit or $2,044/day No-payment denial rate of 0.5% Total Reimbursement Commercial/Managed Care 58% of Charge No-payment derail rate of 12% 20% patient coinsurance @40% collection rate Self-Pay/No Insurance 30% discount 5% self-pay collection rate Total Reimbursement Metric Metric DefinitionHospital Benchmark Clinic Benchmark Net patient accounts Overall Metrics /R days 28.5 days receivable(Annual patient 48.3 days service revenue/365 days) Defect Metrics Scheduling Registration Case management Clinical charge processing Medical records Billing Payment posting
Step by Step Solution
There are 3 Steps involved in it

Get step-by-step solutions from verified subject matter experts