

Question: Can someone help me with this excel work? I need help with: linearize for part a, part d, e and f. Thank you! Here is
Can someone help me with this excel work? I need help with: linearize for part a, part d, e and f.
Thank you!
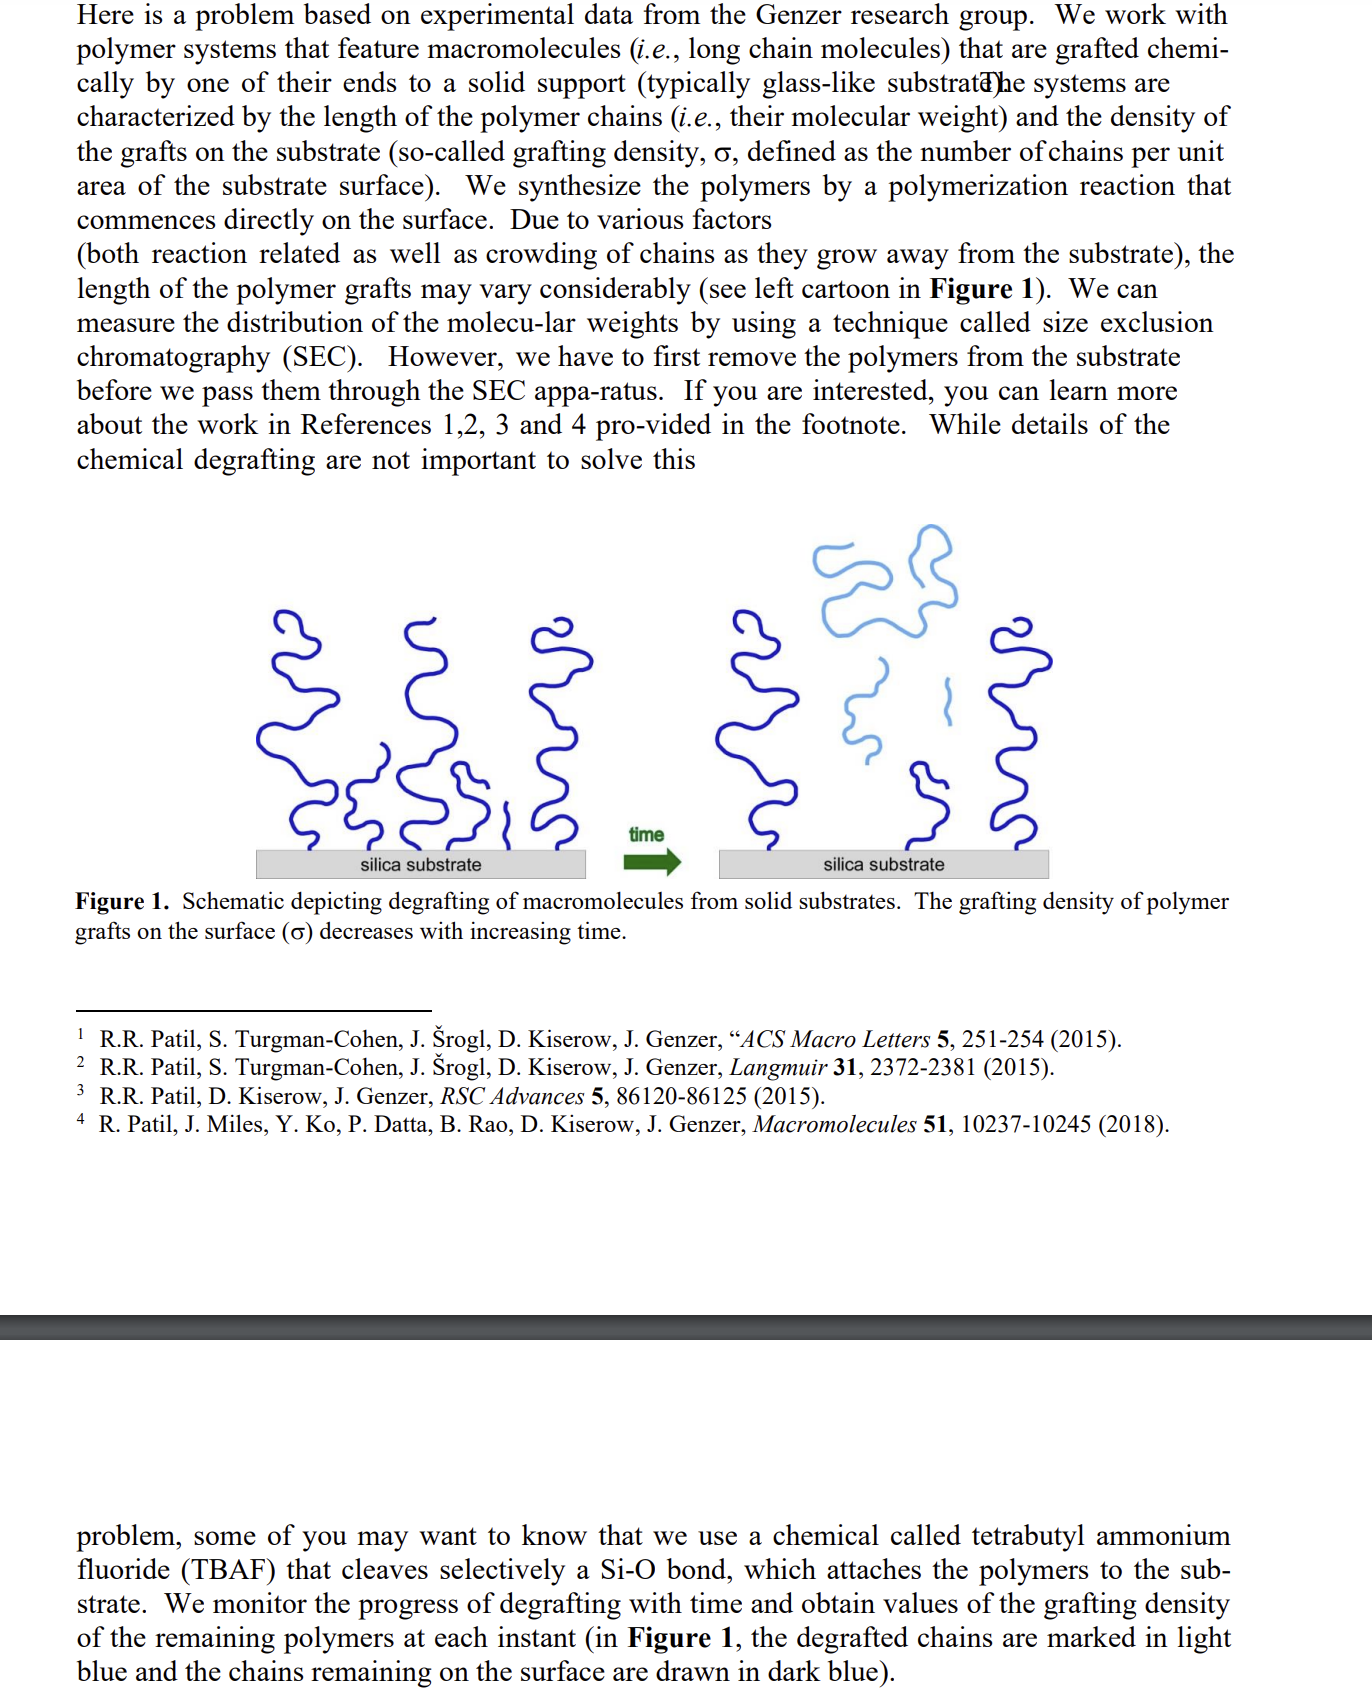
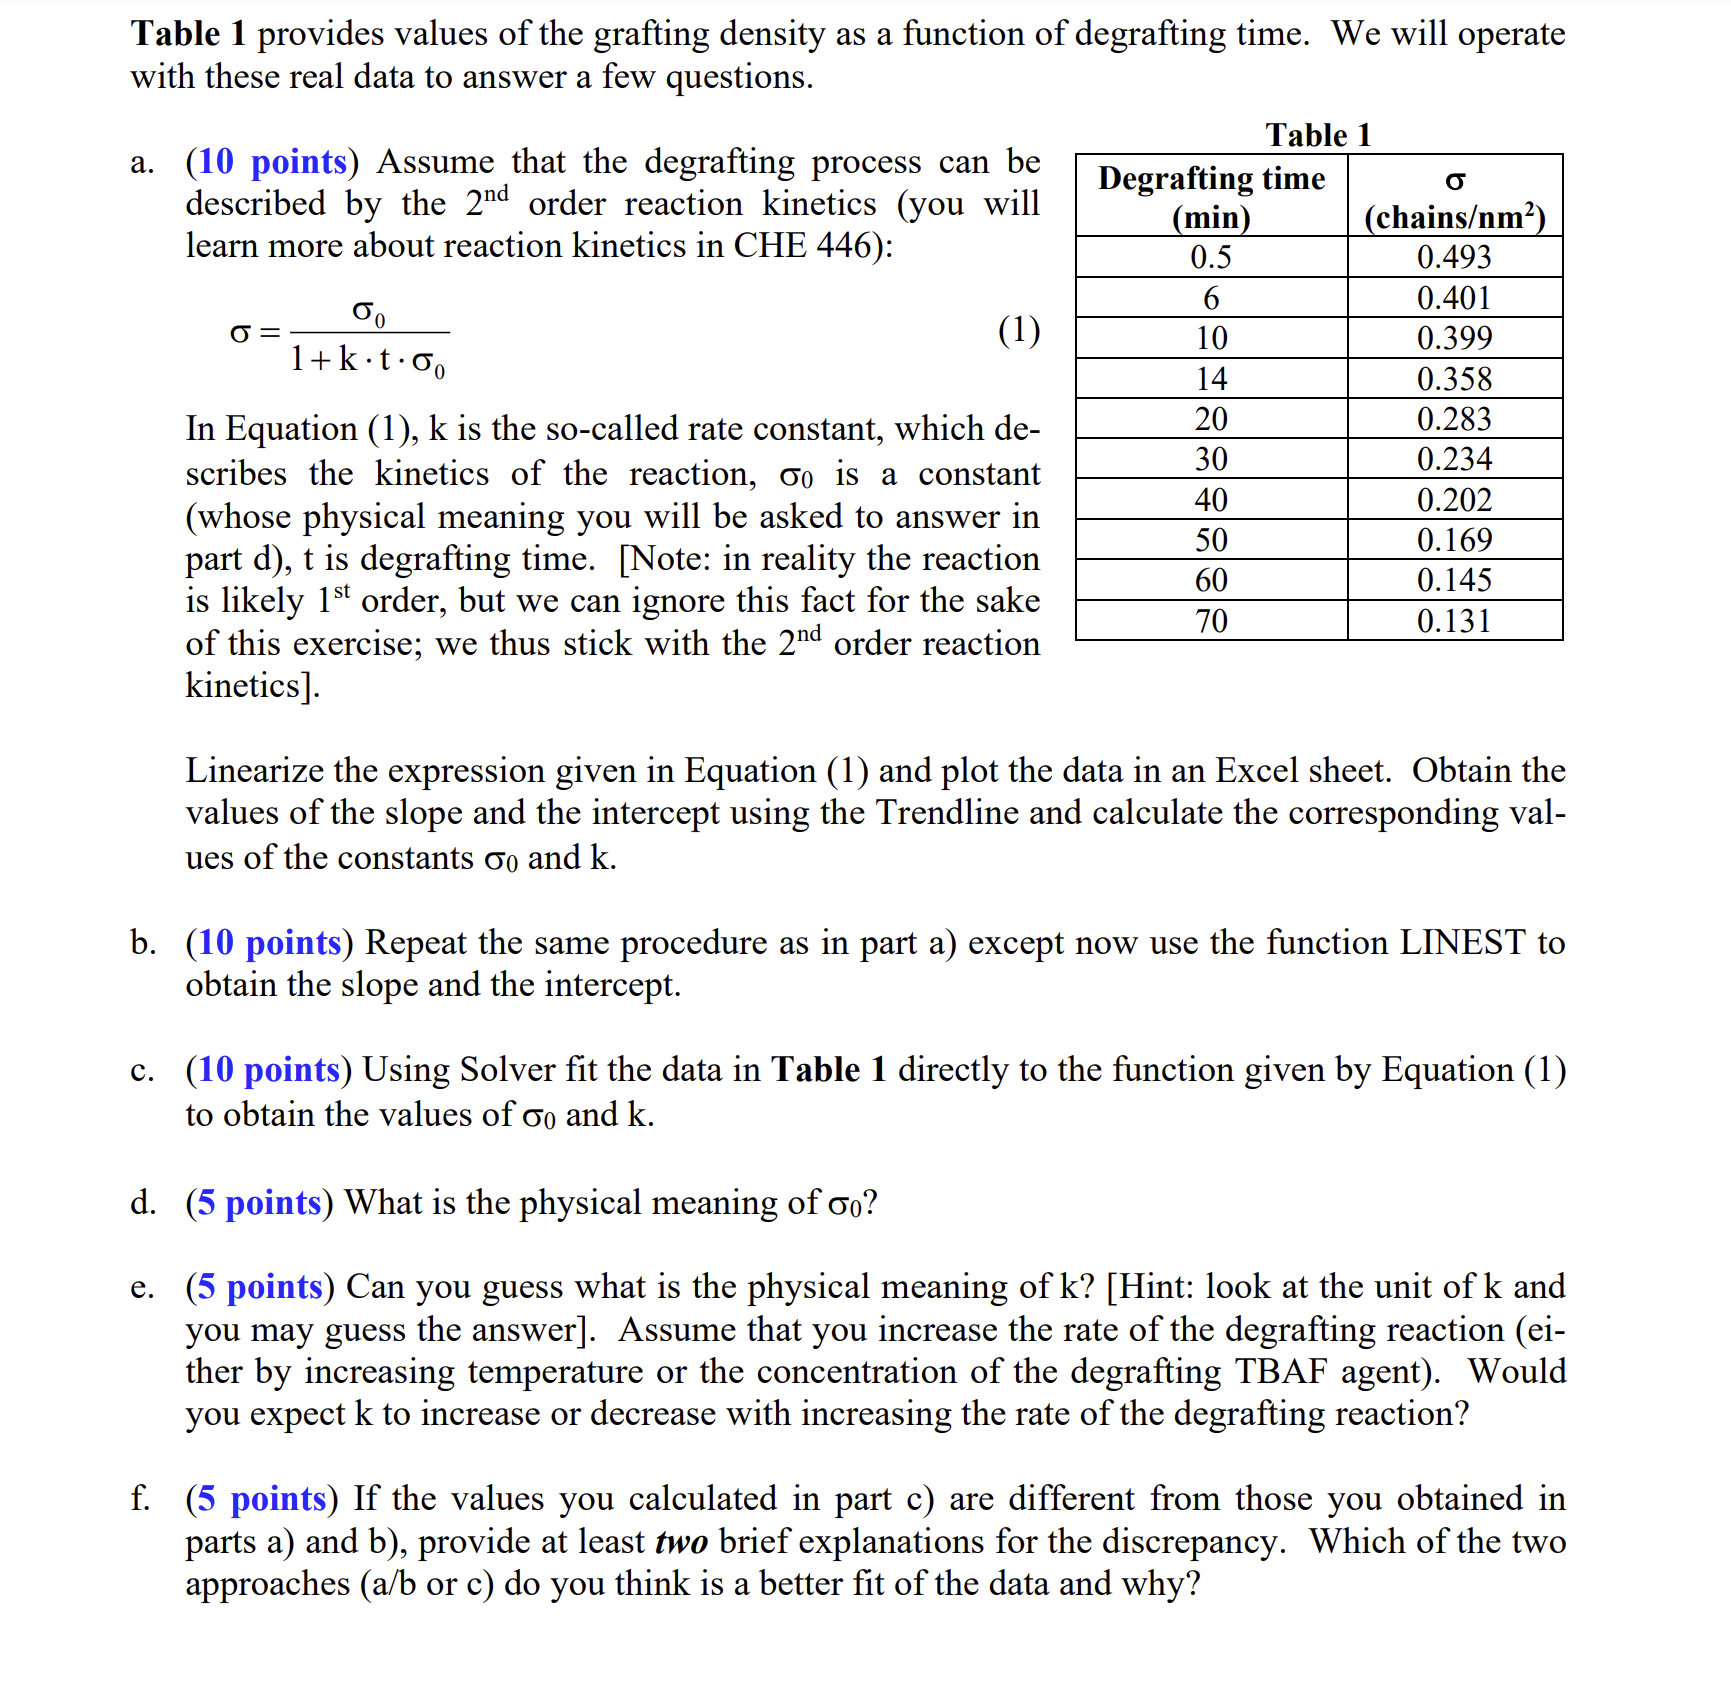
Here is a problem based on experimental data from the Genzer research group. We work with polymer systems that feature macromolecules (i.e., long chain molecules) that are grafted chemically by one of their ends to a solid support (typically glass-like substrat)he systems are characterized by the length of the polymer chains (i.e., their molecular weight) and the density of the grafts on the substrate (so-called grafting density, , defined as the number of chains per unit area of the substrate surface). We synthesize the polymers by a polymerization reaction that commences directly on the surface. Due to various factors (both reaction related as well as crowding of chains as they grow away from the substrate), the length of the polymer grafts may vary considerably (see left cartoon in Figure 1). We can measure the distribution of the molecu-lar weights by using a technique called size exclusion chromatography (SEC). However, we have to first remove the polymers from the substrate before we pass them through the SEC appa-ratus. If you are interested, you can learn more about the work in References 1,2, 3 and 4 pro-vided in the footnote. While details of the chemical degrafting are not important to solve this Figure 1. Schematic depicting degrafting of macromolecules from solid substrates. The grafting density of polymer grafts on the surface () decreases with increasing time. 1 R.R. Patil, S. Turgman-Cohen, J. rogl, D. Kiserow, J. Genzer, "ACS Macro Letters 5, 251-254 (2015). 2 R.R. Patil, S. Turgman-Cohen, J. rogl, D. Kiserow, J. Genzer, Langmuir 31, 2372-2381 (2015). 3 R.R. Patil, D. Kiserow, J. Genzer, RSC Advances 5, 86120-86125 (2015). 4 R. Patil, J. Miles, Y. Ko, P. Datta, B. Rao, D. Kiserow, J. Genzer, Macromolecules 51, 10237-10245 (2018). problem, some of you may want to know that we use a chemical called tetrabutyl ammonium fluoride (TBAF) that cleaves selectively a SiO bond, which attaches the polymers to the substrate. We monitor the progress of degrafting with time and obtain values of the grafting density of the remaining polymers at each instant (in Figure 1, the degrafted chains are marked in light blue and the chains remaining on the surface are drawn in dark blue). Table 1 provides values of the grafting density as a function of degrafting time. We will operate with these real data to answer a few questions. a. (10 points) Assume that the degrafting process can be described by the 2nd order reaction kinetics (you will learn more about reaction kinetics in CHE 446): =1+kt00 In Equation (1), k is the so-called rate constant, which describes the kinetics of the reaction, 0 is a constant (whose physical meaning you will be asked to answer in part d), t is degrafting time. [Note: in reality the reaction is likely 1st order, but we can ignore this fact for the sake of this exercise; we thus stick with the 2nd order reaction kinetics]. Linearize the expression given in Equation (1) and plot the data in an Excel sheet. Obtain the values of the slope and the intercept using the Trendline and calculate the corresponding values of the constants 0 and k. b. (10 points) Repeat the same procedure as in part a) except now use the function LINEST to obtain the slope and the intercept. c. (10 points) Using Solver fit the data in Table 1 directly to the function given by Equation (1) to obtain the values of 0 and k. d. (5 points) What is the physical meaning of 0 ? e. (5 points) Can you guess what is the physical meaning of k ? [Hint: look at the unit of k and you may guess the answer]. Assume that you increase the rate of the degrafting reaction (either by increasing temperature or the concentration of the degrafting TBAF agent). Would you expect k to increase or decrease with increasing the rate of the degrafting reaction? f. (5 points) If the values you calculated in part c) are different from those you obtained in parts a) and b), provide at least to brief explanations for the discrepancy. Which of the two approaches (a/b or c) do you think is a better fit of the data and why
Step by Step Solution
There are 3 Steps involved in it

Get step-by-step solutions from verified subject matter experts