

Question: Can someone help me with this MATLAB problem? Make a plot for each curve fit (a)-(d) (as lines) with the given data as symbols (use
Can someone help me with this MATLAB problem?
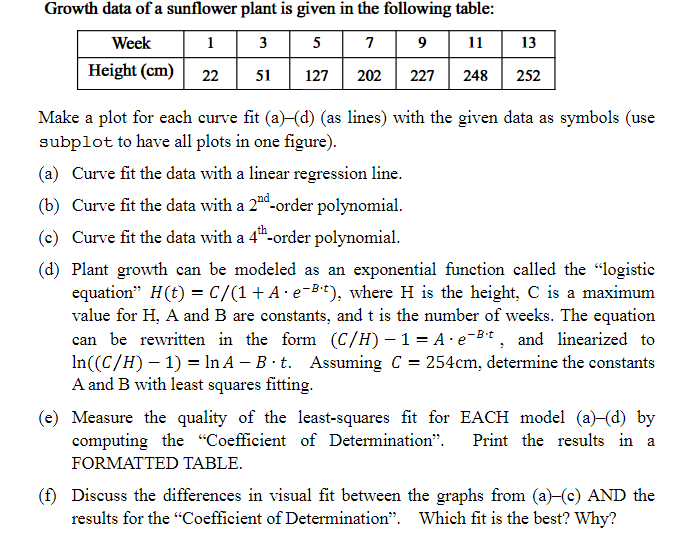
Make a plot for each curve fit (a)-(d) (as lines) with the given data as symbols (use subplot to have all plots in one figure). (a) Curve fit the data with a linear regression line. (b) Curve fit the data with a 2^nd-order polynomial. (c) Curve fit the data with a 4^th-order polynomial. (d) Plant growth can be modeled as an exponential function called the "logistic equation" H(t) = C/(l + A = e^-B t), where H is the height, C is a maximum value for H, A and B are constants, and t is the number of weeks. The equation can be rewritten in the form (C/H) - 1 = A middot e^-B t, and linearized to ln{{C/H) - 1) = ln A - B middot t. Assuming C = 254cm. determine the constants A and B with least squares fitting. (e) Measure the quality of the least-squares fit for EACH model (a)-(d) by computing the "Coefficient of Determination". Print the results in a FORMATTED TABLE. (f) Discuss the differences in visual fit between the graphs from (a)-(c) AND the results for the "Coefficient of Determination". Which fit is the best? Why
Step by Step Solution
There are 3 Steps involved in it

Get step-by-step solutions from verified subject matter experts