

Question: Can someone help me with this please QUANTITY The diagram above shows the demand and supply curves for a normal good. The equilibrium price muld
Can someone help me with this please
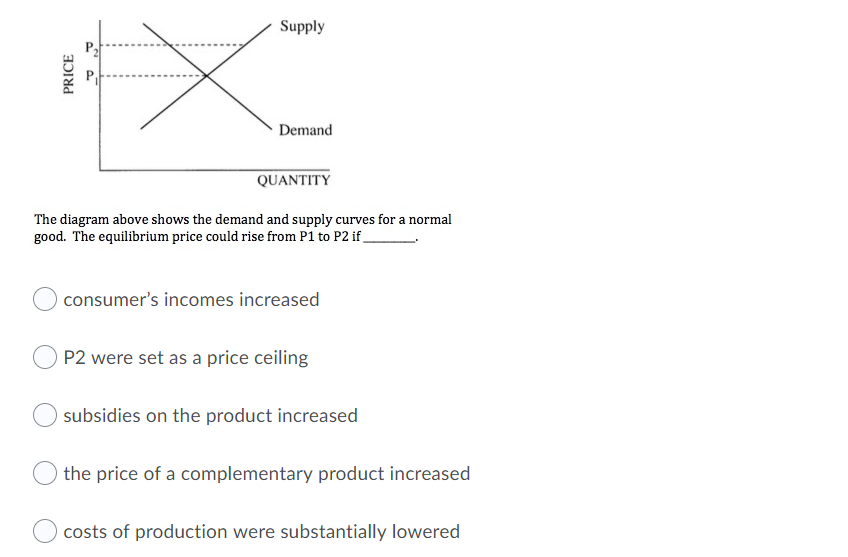
QUANTITY The diagram above shows the demand and supply curves for a normal good. The equilibrium price muld rise from P1 to P2 if 0 consumer's incomes increased 0 P2 were set as a price ceiling O subsidies on the product increased 0 the price of a complementary product increased 0 costs of production were substantially lowered
Step by Step Solution
There are 3 Steps involved in it
1 Expert Approved Answer
Step: 1 Unlock

Question Has Been Solved by an Expert!
Get step-by-step solutions from verified subject matter experts
Step: 2 Unlock
Step: 3 Unlock