

Question: Can someone help me with this problem? 3. A data from the 1990 Census for 26 randomly selected Metropolitan Statistical Areas(msa) were discussed. Of interest
Can someone help me with this problem?
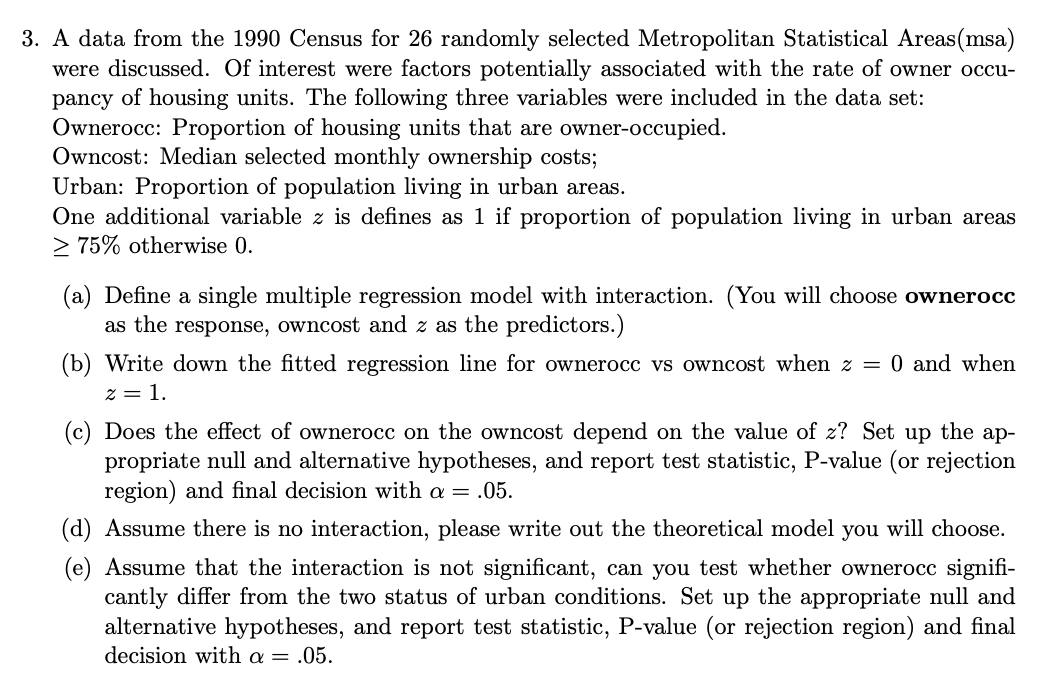
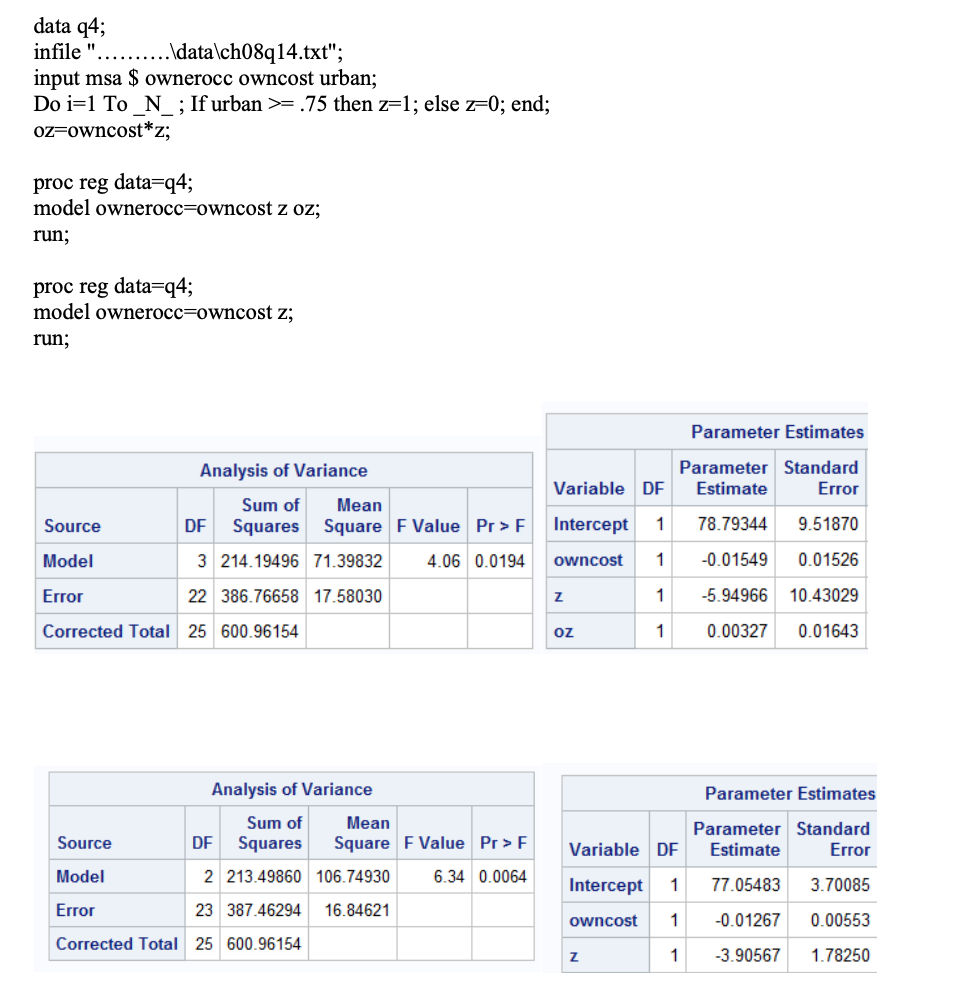
3. A data from the 1990 Census for 26 randomly selected Metropolitan Statistical Areas(msa) were discussed. Of interest were factors potentially associated with the rate of owner occur pancy of housing units. The following three variables were included in the data set: Ownerocc: Proportion of housing units that are owner-occupied. Owncost: Median selected monthly ownership costs; Urban: Proportion of population living in urban areas. One additional variable z is defines as 1 if proportion of population living in urban areas 2 75% otherwise 0. (a) Define a single multiple regression model with interaction. (You will choose ownerocc as the response, owncost and z as the predictors.) (b) Write down the fitted regression line for ownerocc vs owncost when z = 0 and when 2 = 1. (c) Does the effect of ownerocc on the owncost depend on the value of z? Set up the ap- propriate null and alternative hypotheses, and report test statistic, P-value (or rejection region) and final decision with a = .05. (d) Assume there is no interaction, please write out the theoretical model you will choose. (e) Assume that the interaction is not significant, can you test whether ownerocc signifi- cantly differ from the two status of urban conditions. Set up the appropriate null and alternative hypotheses, and report test statistic, P-value (or rejection region) and final decision with a = .05.data q4; infile "..........\\data\\ch08q14.txt"; input msa $ ownerocc owncost urban; Do i=1 To _N_; If urban >= .75 then z=1; else z-0; end; oz-owncost*z; proc reg data=q4; model ownerocc=owncost z oz; run; proc reg data=q4; model ownerocc=owncost z; run; Parameter Estimates Analysis of Variance Parameter Standard Variable DF Estimate Error Sum of Mean Source DE Squares Square F Value Pr > F Intercept 1 78.79344 9.51870 Model 3 214 19496 71.39832 4.06 0.0194 owncost -0.01549 0.01526 Error 22 386.76658 17.58030 1 -5.94966 10.43029 Corrected Total 25 600.96154 OZ 1 0.00327 0.01643 Analysis of Variance Parameter Estimates Sum of Mean Parameter Standard Source DF Squares Square F Value Pr > F Variable DF Estimate Error Model 2 213.49860 106.74930 6.34 0.0064 Intercept 77.05483 3.70085 Error 23 387.46294 16.84621 owncost 1 -0.01267 0.00553 Corrected Total 25 600.96154 -3.90567 1.78250
Step by Step Solution
There are 3 Steps involved in it

Get step-by-step solutions from verified subject matter experts