

Question: can someone help Problem 17-1A Calculating and analyzing trend percents LO P1 Selected comparative financial statements of Haroun Company follow. AROUN COMPANY Comparative Income Statenents
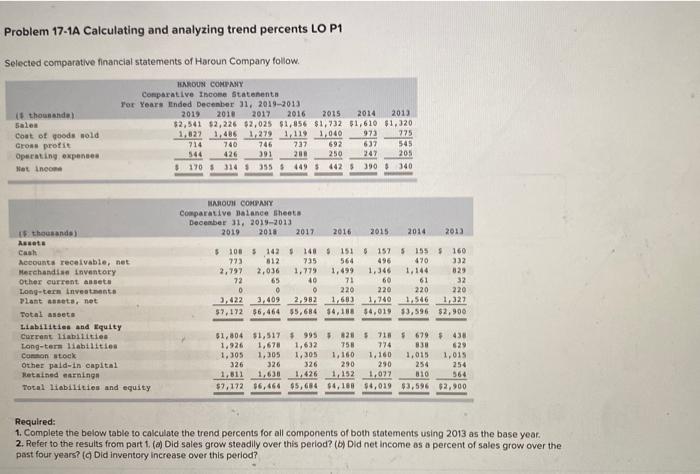
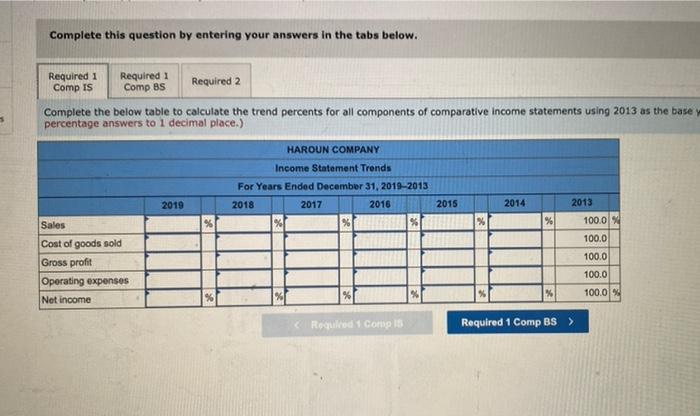
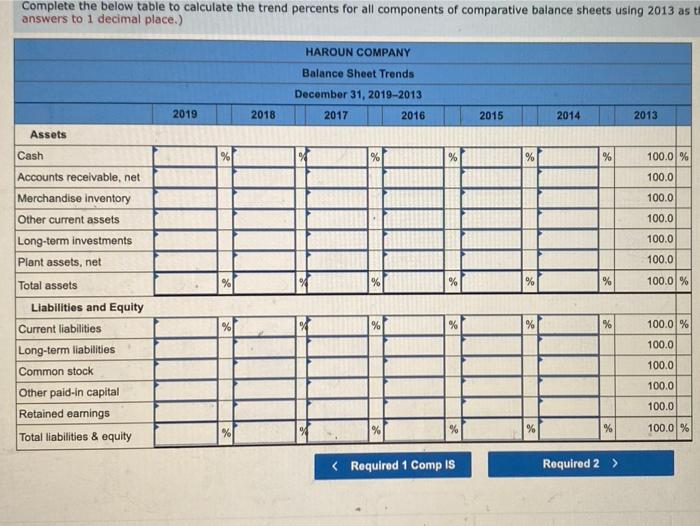
Problem 17-1A Calculating and analyzing trend percents LO P1 Selected comparative financial statements of Haroun Company follow. AROUN COMPANY Comparative Income Statenents Tor Years Ended December 31, 2019-2013 2019 2010 2017 2016 2015 2014 2013 $2,541 $2,226 $2,025 $1,856 $1,732 $1,610 $1,320 1.822 1,486 1,2791,119 1,040 973 714 740 746 737 637 545 544 426 391 200 250 247 205 $ 170$ 314 $ 35 $ 449 $ 442 5 390 340 t thousands sales Coat of yoods sold Cross profit Operating expenses Nat income SEL 269 $ ) MAROUN COMPANY Comparative Balance sheets December 31, 2019-2013 2019 2010 2017 2016 2015 2014 2013 + CLL 1 T $ 1085 142 148 151 $ 157 5 155 $ 160 612 735 564 496 470 332 2.797 2,036 1.779 1,499 1,346 1,144 829 72 65 40 60 32 0 220 220 220 220 3.422 3,409 2,982 1,683 1.740 1.546 1,327 $7.172 $6,464 55,684 $4,188 $4,019 $3,596 $2,900 TL 19 thousands Assets Cash Accounts receivable, net Merchandise inventory Other current annet Long-term investments Plant est. net Total assets Liabilities and Equity Current liabilities Long-term liabilities Comon stock Other paid in capital Retained earnings Total liabilities and equity 0 $ $ $ 5 8 $ Sort $1,804 $1,517 $ 995 5 828 $ 78 $ 679 $ 438 1.926 1.678 1.632 758 774 838 629 1,305 1,305 1,160 1.160 1,015 1,015 326 326 326 290 290 254 254 1,811 1,426 1,152 810 $7,172 $6,464 $5,684 $4,186 $4,019 $3,596 62.900 LLOT 564 Required: 1. Complete the below table to calculate the trend percents for all components of both statements using 2013 as the base year. 2. Refer to the results from part 1. (d) Did sales grow steadily over this period? (o) Did net income as a percent of sales grow over the past four years? (Did Inventory increase over this period? Complete this question by entering your answers in the tabs below. Required 1 Comp IS Required Comp BS Required 2 Complete the below table to calculate the trend percents for all components of comparative Income statements using 2013 as the base percentage answers to 1 decimal place.) HAROUN COMPANY Income Statement Trends For Years Ended December 31, 2019-2013 2018 2017 2016 % % % 2019 2015 2014 2013 100.0 % % Sales Cost of goods sold Gross profit Operating expenses Not income 100.0 100.0 100.0 100.0% Required 1 Comp 15 Required 1 Comp BS > Complete the below table to calculate the trend percents for all components of comparative balance sheets using 2013 as to answers to 1 decimal place.) HAROUN COMPANY Balance Sheet Trends December 31, 2019-2013 2017 2016 2019 2018 2015 2014 2013 Assets Cash % % 100.0 % 100.0 100.0 Accounts receivable.net Merchandise inventory Other current assets Long-term investments Plant assets, net 100.0 100.0 100.0 % % % 100.0 % Total assets Liabilities and Equity % % % % % 100.0 % 100.0 Current liabilities Long-term liabilities Common stock 100.0 100.0 100.0 Other paid-in capital Retained earnings Total liabilities & equity % 100.0 %
Step by Step Solution
There are 3 Steps involved in it

Get step-by-step solutions from verified subject matter experts