

Question: can. someone help with steps on. how to do this in excel B 1) stdev (1 pt) formulatext Stock A B 0.0200 0.0003 -0.0130 0.0003
can. someone help with steps on. how to do this in excel
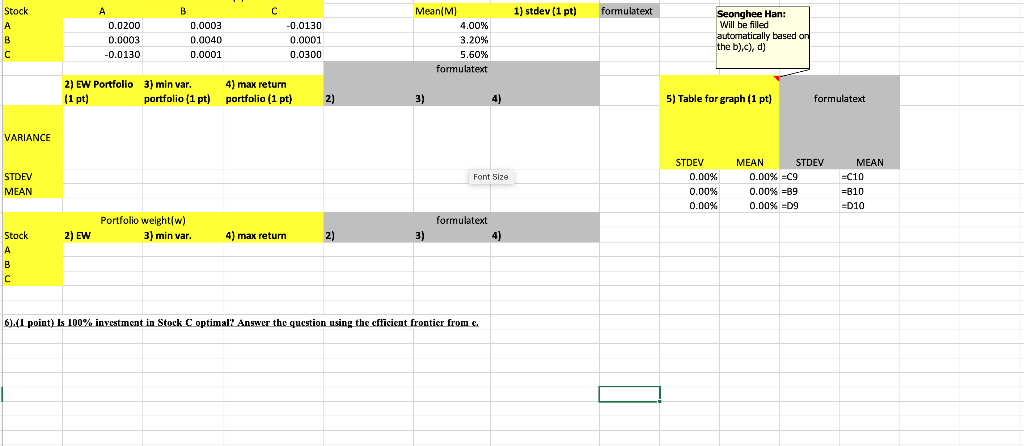
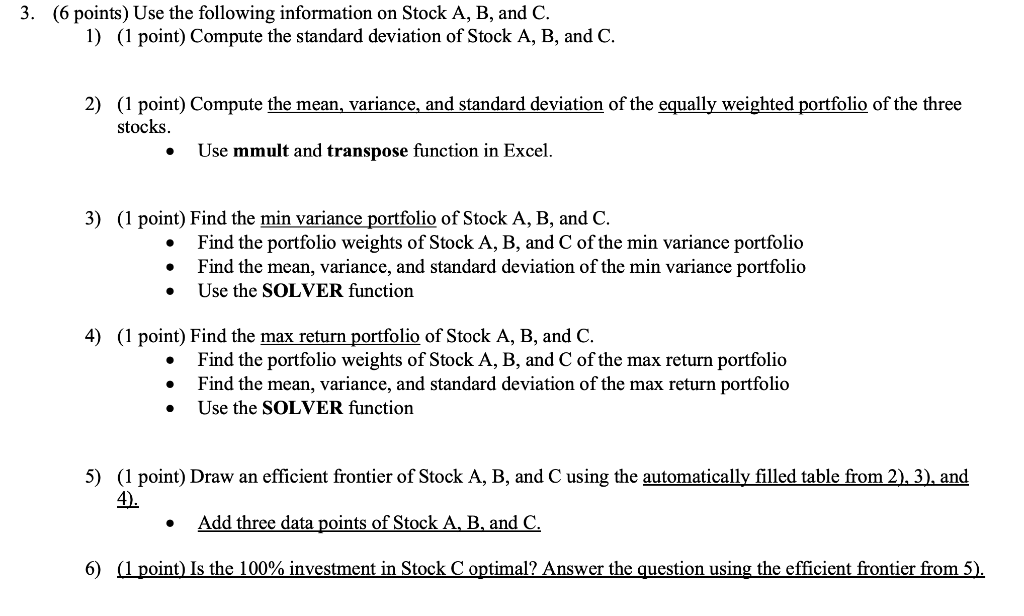
B 1) stdev (1 pt) formulatext Stock A B 0.0200 0.0003 -0.0130 0.0003 0.0040 0.0001 -0.0130 0.0001 0.0300 Mean(M) 4.00% 3.20% 5.60% formulatext Seonghee Han: Will be filled automatically based on the b) c), d) 2) EW Portfolio 3) min var. 4) max return (1 pt) portfolio (1 pt) portfolio (1 pt) 2) 3) 4) 5) Table for graph (1 pt) formulatext VARIANCE Font Size STDEV MEAN STDEV 0.00% 0.00% 0.00% MEAN STDEV 0.00% =C9 0.00% -89 0.00% =D9 MEAN =C10 =B10 = =D10 Portfolio weight/w) 3) min var. formulatext 4) 2) EW 4) max return 2) 3) Stock A B 6).(1 point) Is 100% investment in Stock C optimal? Answer the question using the cfficient frontier from c. 3. (6 points) Use the following information on Stock A, B, and C. 1) (1 point) Compute the standard deviation of Stock A, B, and C. 2) (1 point) Compute the mean, variance, and standard deviation of the equally weighted portfolio of the three stocks. Use mmult and transpose function in Excel. 3) (1 point) Find the min variance portfolio of Stock A, B, and C. Find the portfolio weights of Stock A, B, and C of the min variance portfolio Find the mean, variance, and standard deviation of the min variance portfolio Use the SOLVER function 4) (1 point) Find the max return portfolio of Stock A, B, and C. Find the portfolio weights of Stock A, B, and C of the max return portfolio Find the mean, variance, and standard deviation of the max return portfolio Use the SOLVER function 5) (1 point) Draw an efficient frontier of Stock A, B, and C using the automatically filled table from 2), 3), and 4). Add three data points of Stock A, B, and C. 6) (1 point) Is the 100% investment in Stock C optimal? Answer the question using the efficient frontier from 5). B 1) stdev (1 pt) formulatext Stock A B 0.0200 0.0003 -0.0130 0.0003 0.0040 0.0001 -0.0130 0.0001 0.0300 Mean(M) 4.00% 3.20% 5.60% formulatext Seonghee Han: Will be filled automatically based on the b) c), d) 2) EW Portfolio 3) min var. 4) max return (1 pt) portfolio (1 pt) portfolio (1 pt) 2) 3) 4) 5) Table for graph (1 pt) formulatext VARIANCE Font Size STDEV MEAN STDEV 0.00% 0.00% 0.00% MEAN STDEV 0.00% =C9 0.00% -89 0.00% =D9 MEAN =C10 =B10 = =D10 Portfolio weight/w) 3) min var. formulatext 4) 2) EW 4) max return 2) 3) Stock A B 6).(1 point) Is 100% investment in Stock C optimal? Answer the question using the cfficient frontier from c. 3. (6 points) Use the following information on Stock A, B, and C. 1) (1 point) Compute the standard deviation of Stock A, B, and C. 2) (1 point) Compute the mean, variance, and standard deviation of the equally weighted portfolio of the three stocks. Use mmult and transpose function in Excel. 3) (1 point) Find the min variance portfolio of Stock A, B, and C. Find the portfolio weights of Stock A, B, and C of the min variance portfolio Find the mean, variance, and standard deviation of the min variance portfolio Use the SOLVER function 4) (1 point) Find the max return portfolio of Stock A, B, and C. Find the portfolio weights of Stock A, B, and C of the max return portfolio Find the mean, variance, and standard deviation of the max return portfolio Use the SOLVER function 5) (1 point) Draw an efficient frontier of Stock A, B, and C using the automatically filled table from 2), 3), and 4). Add three data points of Stock A, B, and C. 6) (1 point) Is the 100% investment in Stock C optimal? Answer the question using the efficient frontier from 5)
Step by Step Solution
There are 3 Steps involved in it

Get step-by-step solutions from verified subject matter experts